This research was presented to the COVID-19 Mobility Data Network on October 9, 2020, as part of CMDN’s recurring meetings. This week, we explore trends in shelter utilization during disasters seen in the National Shelter System Database in the United States, how mobility data may complement the interpretation of these data, and influence logistics during crisis response.
In the United States, the vast majority of shelters are operated by agencies like the American Red Cross, other not-for-profit organizations, or directly by the county government. During disasters, the sudden demand for services at these shelters contributes to challenges in resource allocation and complicates the logistics of keeping people safe during mass gatherings. Populations that typically make use of shelter services are often lower-income, have smaller social networks, are older, and have a higher level of medical need than the general population.
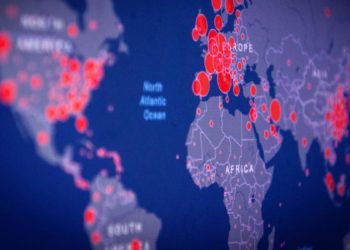
In 2020, the intersection of hurricanes in the Gulf of Mexico and wildfires in California with social distancing measures to contain the spread of COVID-19 has changed how people are sheltered during disasters. This appears to be due to both changes in FEMA and other agency policies and also changes in shelter-seeking behavior. Caleb Dresser, the Climate and Health Fellow at the Harvard FXB Center for Health and Human Rights, draws from available shelter and mobility data to detail how sheltering practices after disasters in the United States in 2020 have greatly differed from similar disasters in previous years.
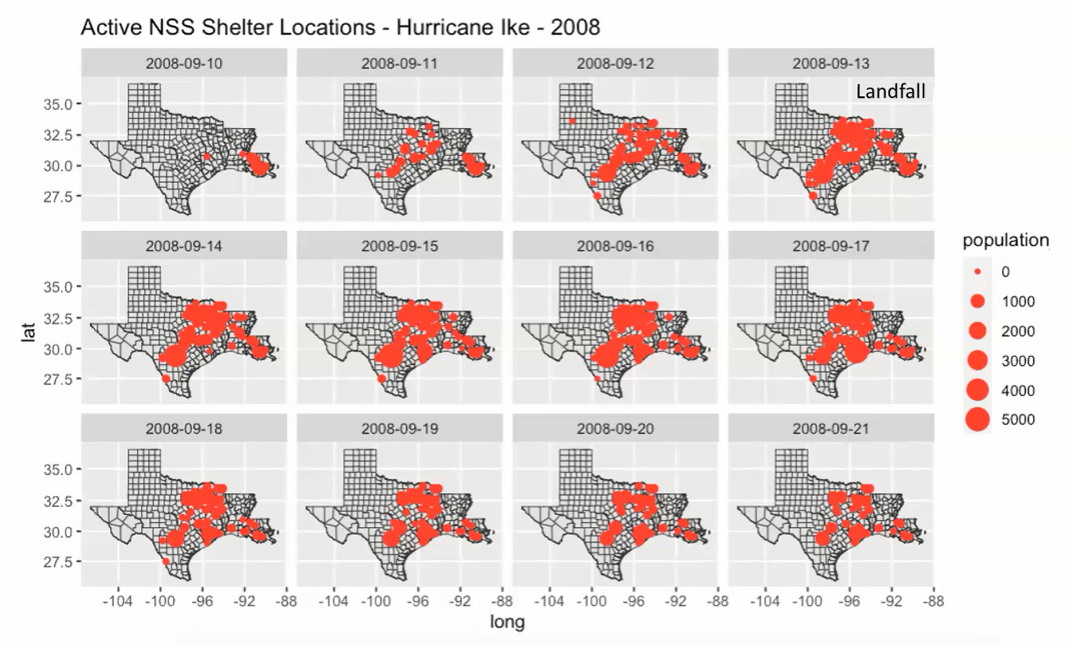
The National Shelter System Database, the primary dataset for this analysis, is hosted by the American Red Cross to inform decision-making during disasters and contains information on the count of individuals at each shelter, shelter locations, shelter capacity, and general resources available to cater to additional displaced individuals. There are opportunities in this dataset to understand how populations respond to disasters; using the midnight census (a count of individuals that stayed overnight at the shelter), date, and location variables, one may be able to piece together information about pre-and post-disaster behavior across time and space.
However, there are limitations to the depth of information provided by this data: 1) it is not possible to accurately infer the length of stay of individuals of families from the aggregate reporting, 2) there is no information on medical or social service utilization, 3) the data do not cover alternate sheltering options such as hotels or short-term rentals, which may have been an important modality during 2020, and 4) there is significant variation in data quality for count data during periods of high usage.
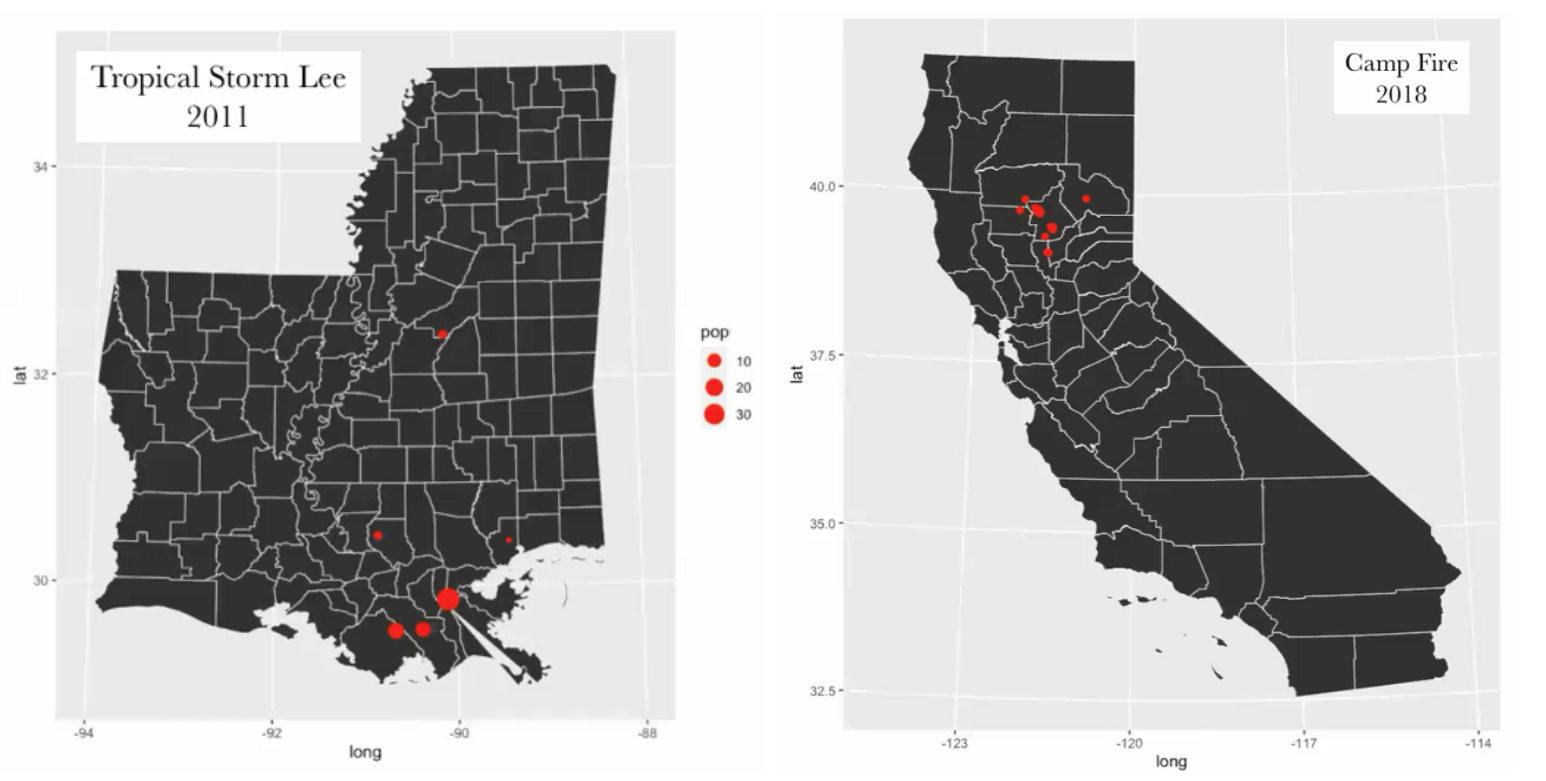
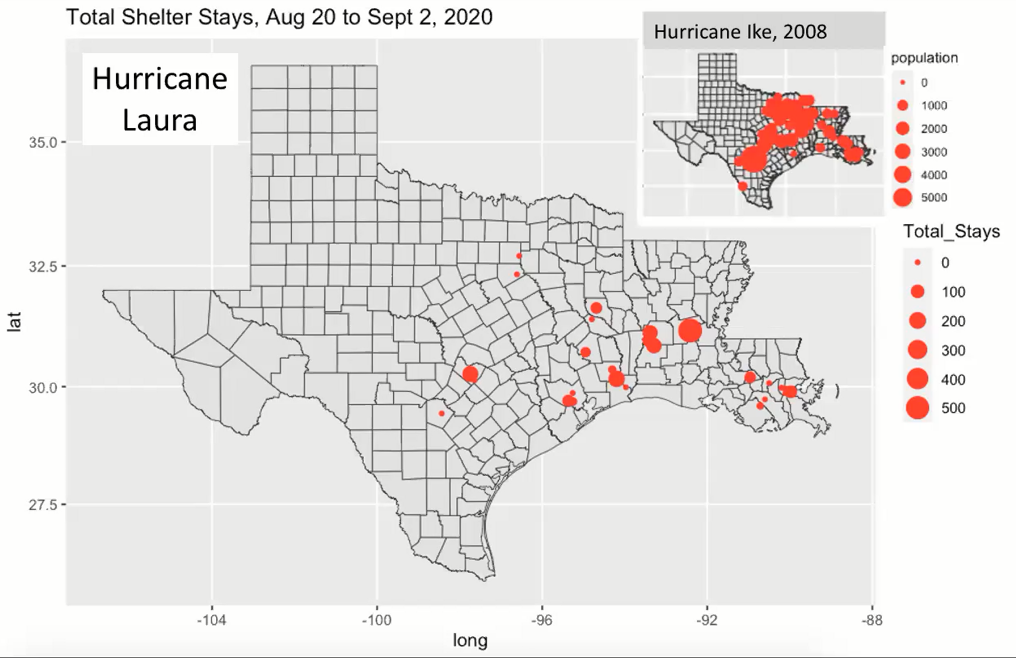
COVID-19 appears to have changed shelter utilization patterns relative to previous years. Total overnight stays in NSS shelters during 2020 are the lowest recorded in the period since records were made available. Looking at data from Hurricane Ike, a category 4 hurricane that made landfall on September 13, 2008, the NSS DATABASE dataset shows an increase in shelter utilization in locations that were not near the affected region, and increasing shelter utilization prior to landfall, indicating pre-emptive evacuation away from homes in the affected region before the hazard occurred.
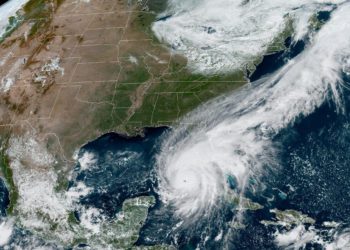
Hurricane Laura, which made landfall on August 29, 2020, resulted in dramatically different behavior from the affected population, despite also being a major hurricane in the same region. Shelter use was substantially lower than in 2008, and shelters further away from the affected region did not report as large an increase in utilization. While the two storms were not identical – differing translation speeds, rainfall, surface flooding, and tracks prevent a perfect direct comparison – the order-of-magnitude difference in shelter use is nonetheless noteworthy.
While media reports on evacuees staying in cars or with friends may explain part of the decrease in shelter utilization, CMDN’s prior analysis using data from Camber Systems showed that people were, in fact, still migrating pre-emptively prior to Hurricane Laura. While the NSS dataset shown here can demonstrate that most did not go to shelters, it does not quantify how many were placed in hotels or received other forms of aid while displaced.
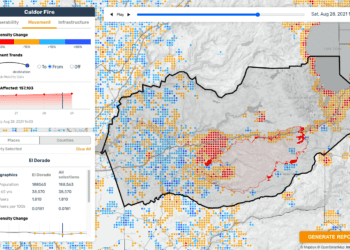
As Hurricane Delta and Hurricane Zeta have made landfall in the same region, there is concern that evacuees in temporary housing are getting caught in between consecutive events. Dr. Dresser is currently working with the CrisisReady team to understand how NSS Database data and mobility data may be used to identify displaced populations from both hurricanes in the Gulf and the wildfires in California.
Additional information on the National Shelter System Database is available here, and examples of code used to explore the NSS Database is available at Github