Disasters in the 21st century, whether natural or man-made, have resulted in persistent increases in morbidity and mortality, long after the acute events have passed. This is a global issue, affecting people in countries around the world. Such crises, ranging from earthquakes and floods to conflicts and pandemics, frequently lead to power outages, evacuations, and damaged transportation and communication networks, among others. These disruptions impede access to essential services and resources, including wages, healthcare, food, and stable housing. Sometimes these impediments persist for extended periods of time.
To safeguard vulnerable populations during such crises, it is imperative for response agencies and health systems to have detailed, timely information. They need to understand who is relocating, when these movements are occurring, and the destinations to which these individuals are moving. This information is critical for the effective mobilization of material resources and personnel.
As the incidence of these crises increases, it is important to ensure that emergency preparedness and response efforts are able to meet the needs of the medically vulnerable, and socially disadvantaged.
Since 2019, our team at CrisisReady has collaborated with public health agencies in various regions, including those in California such as the California Department of Public Health (CDPH), the California Governor’s Office of Emergency Services (CalOES), the California Conference of Local Health Officers (CCLHO), the Emergency Medical Services Authority (EMSA), and hospital systems to strengthen data-driven decision making. Our model of collaboration is designed to be adaptable, with the aim of engaging partners worldwide.
The ReadyMapper Tool
Originally designed to support local responses to wildfires and hurricanes in the United States, ReadyMapper has since evolved into a tool for the global response community. It is now scalable to a wide variety of disasters and crises around the world. Recognizing the universal need for effective, data-driven emergency response, the CrisisReady team has expanded the tool’s capabilities to serve diverse regions and disaster types.
The tool combines data on community demographics, vulnerabilities, health infrastructure, and mobility to track evolving needs as populations evacuate and move elsewhere. ReadyMapper has been especially helpful in helping response agencies track population movement and displacement, identify which areas people are moving towards and away from, and deploy resources accordingly.
Our team has used the tool during a number of disasters in 2023, including the earthquakes in Turkey and Syria, Cyclone Mocha in Myanmar and Bangladesh, and the floods in northern Libya.
Watch a video walkthrough of the ReadyMapper tool here, and continue reading to learn about the platform’s various capabilities.
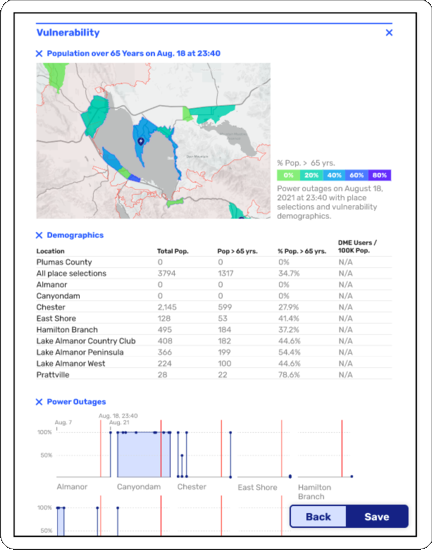
Mapping Vulnerability
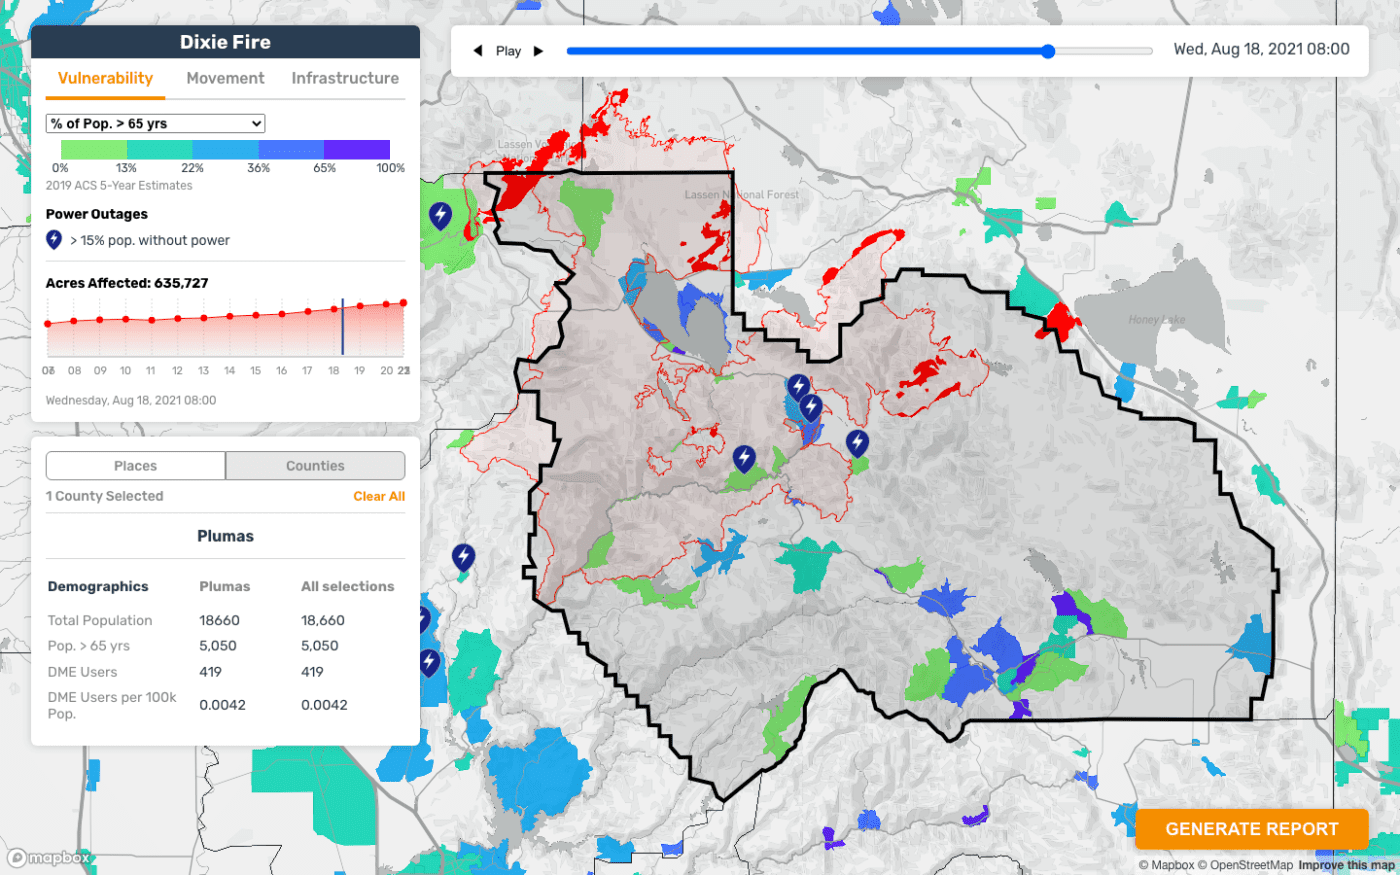
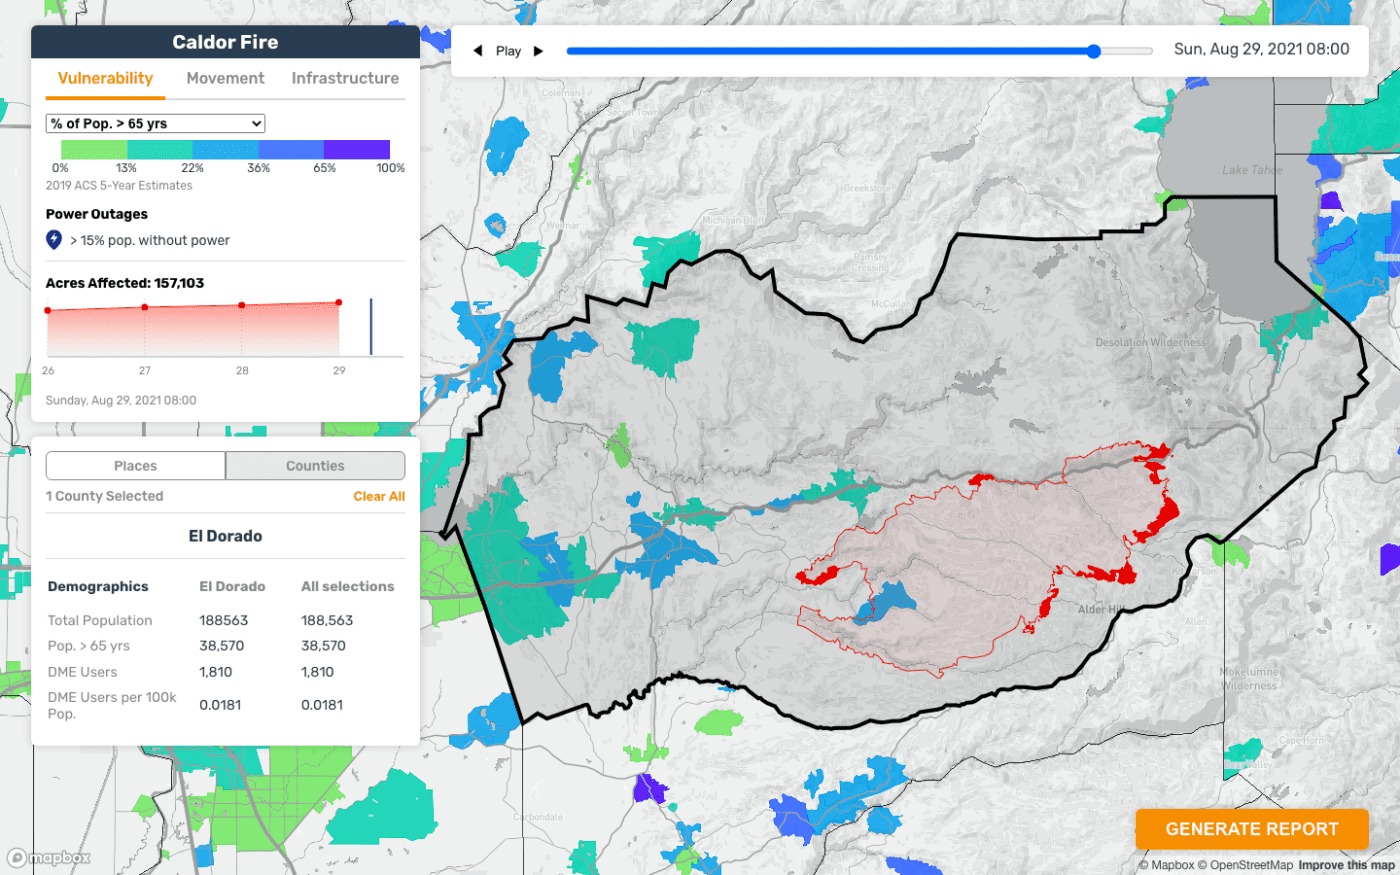
The tool’s first vantage point presents data on population vulnerabilities, which can be defined in multiple and often intersecting ways.
ReadyMapper offers insights into population vulnerabilities, including data on the percentage of the elderly population, the percentage reliant on durable medical equipment, and information on socioeconomic status.
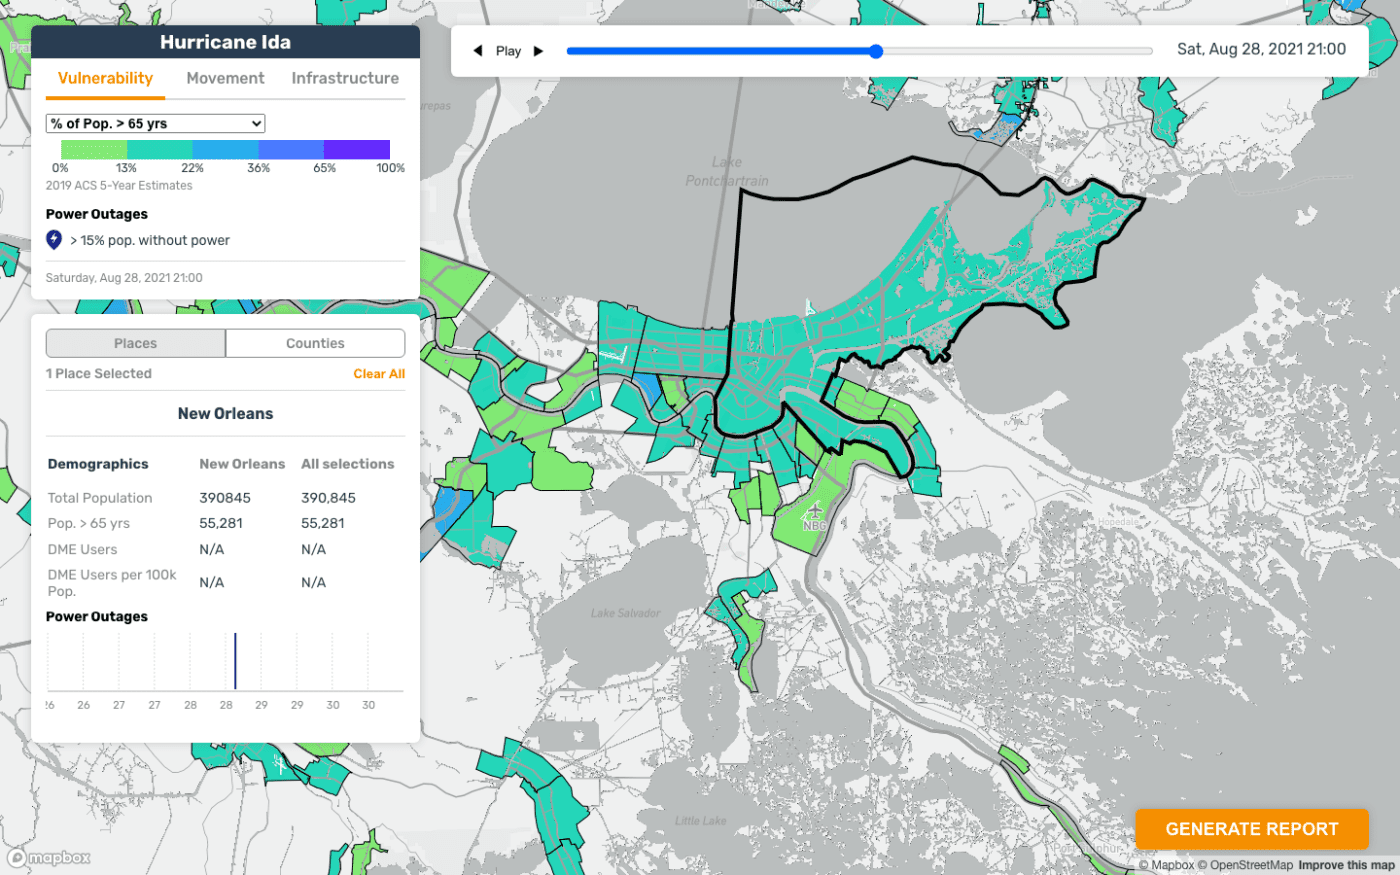
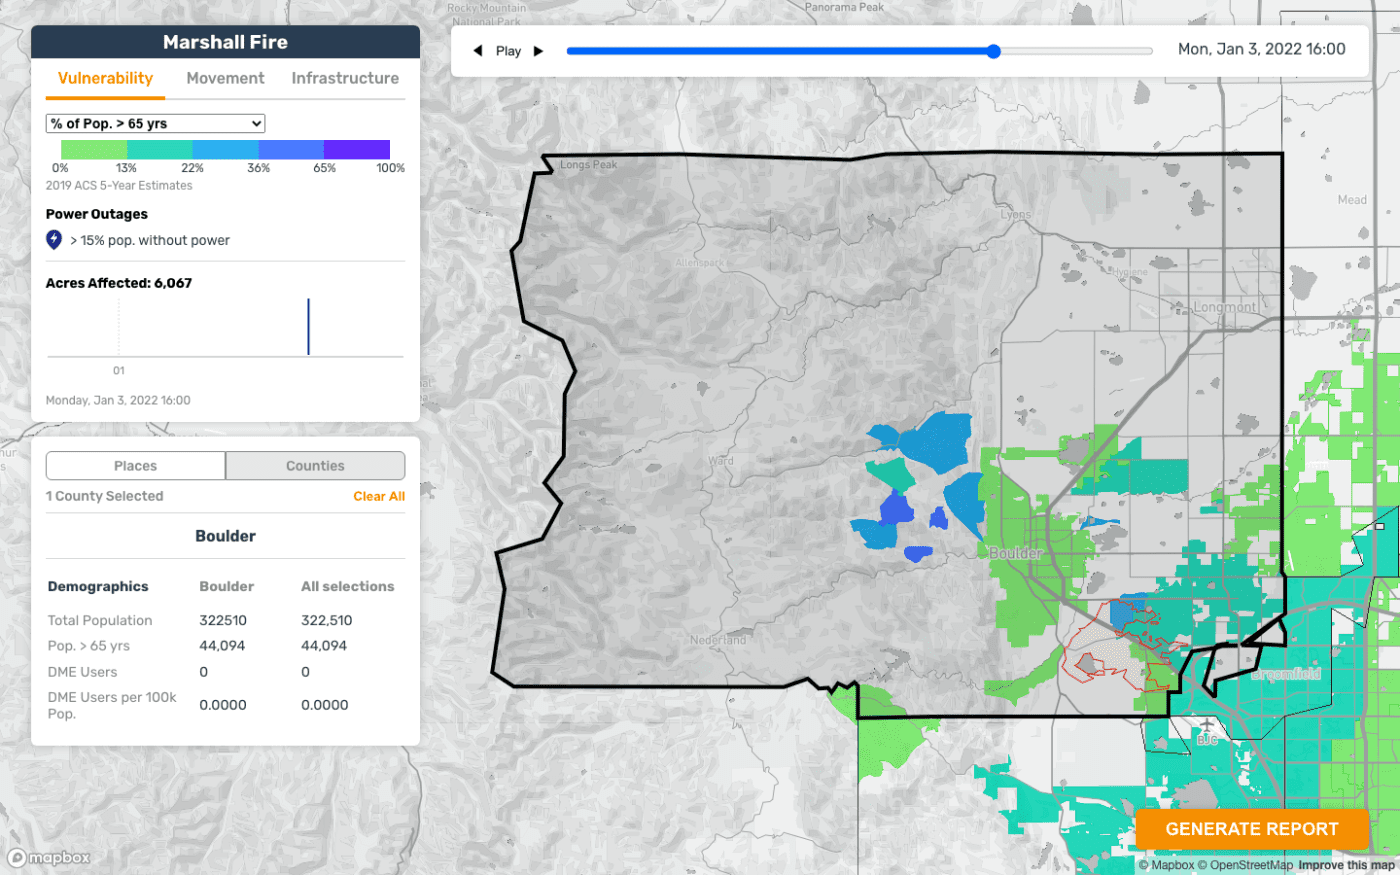
There are other composite indices taken into account, including the Healthy Places Index (HPI) published by the Public Health Alliance of Southern California’s and the Social Vulnerability index published by the Centers for Disease Control and Prevention (CDC) and the Agency for Toxic Substances and Disease Registry (ATSDR). Immigration status and language barriers are additional vulnerabilities considered in these visualizations.
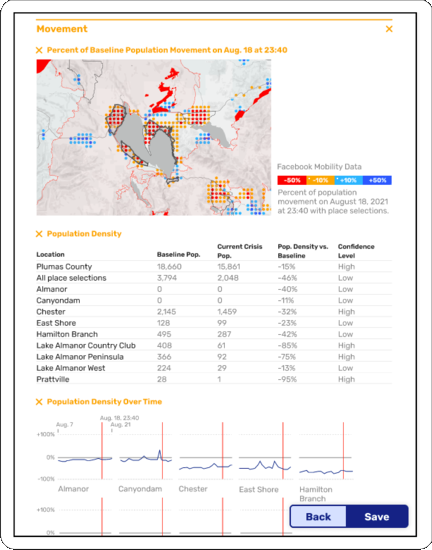
Mapping Movement
The tool’s second vantage point presents data on human mobility and movement patterns during an emergency event. The tool uses aggregated and anonymized human mobility data from the Data for Good program at Meta, which provides consented location data from users using various Meta applications on their mobile devices.
The data provides information on the fluctuations of population densities, providing a proxy for movement and displacement.
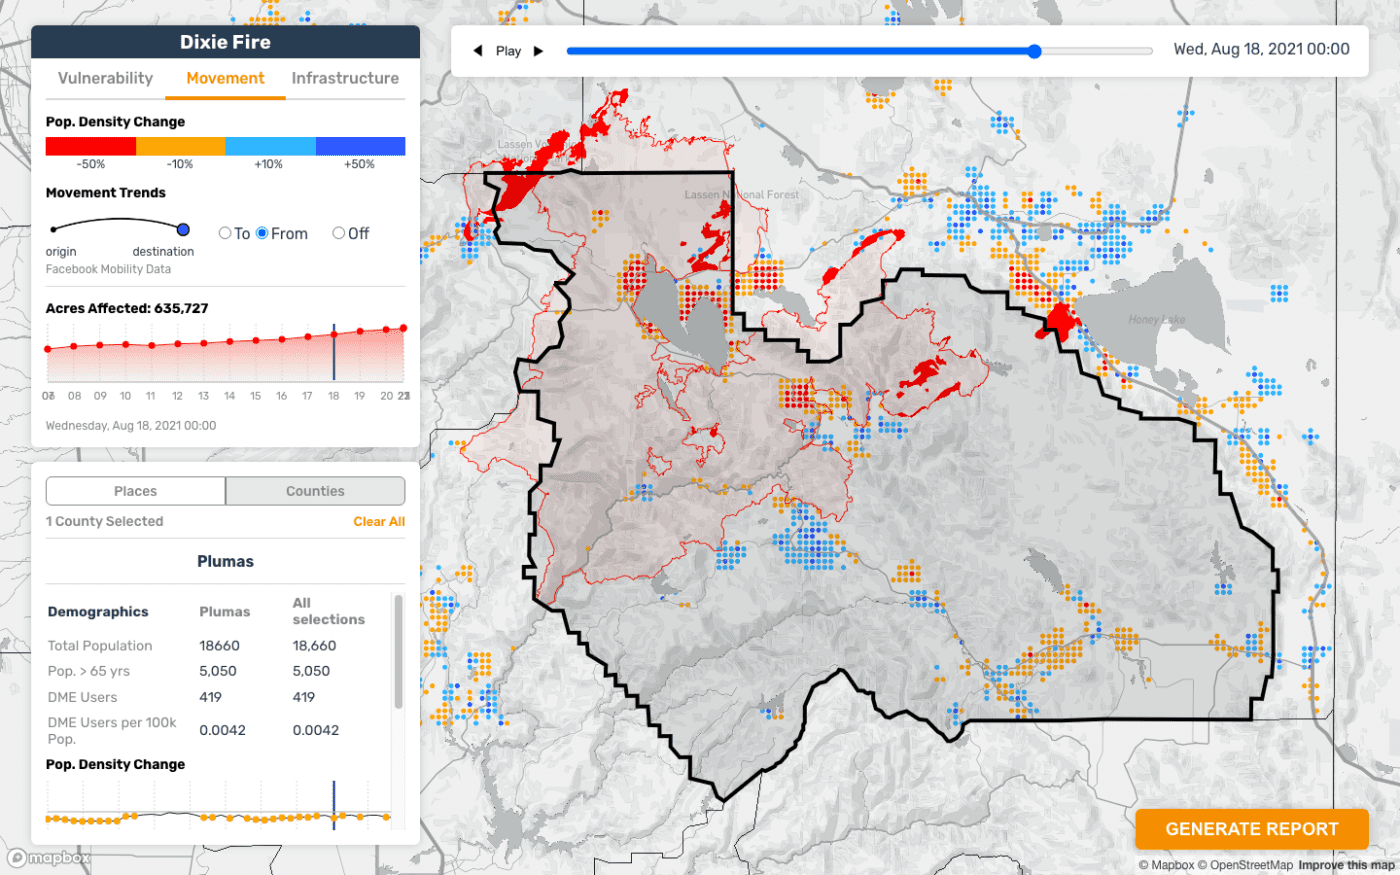
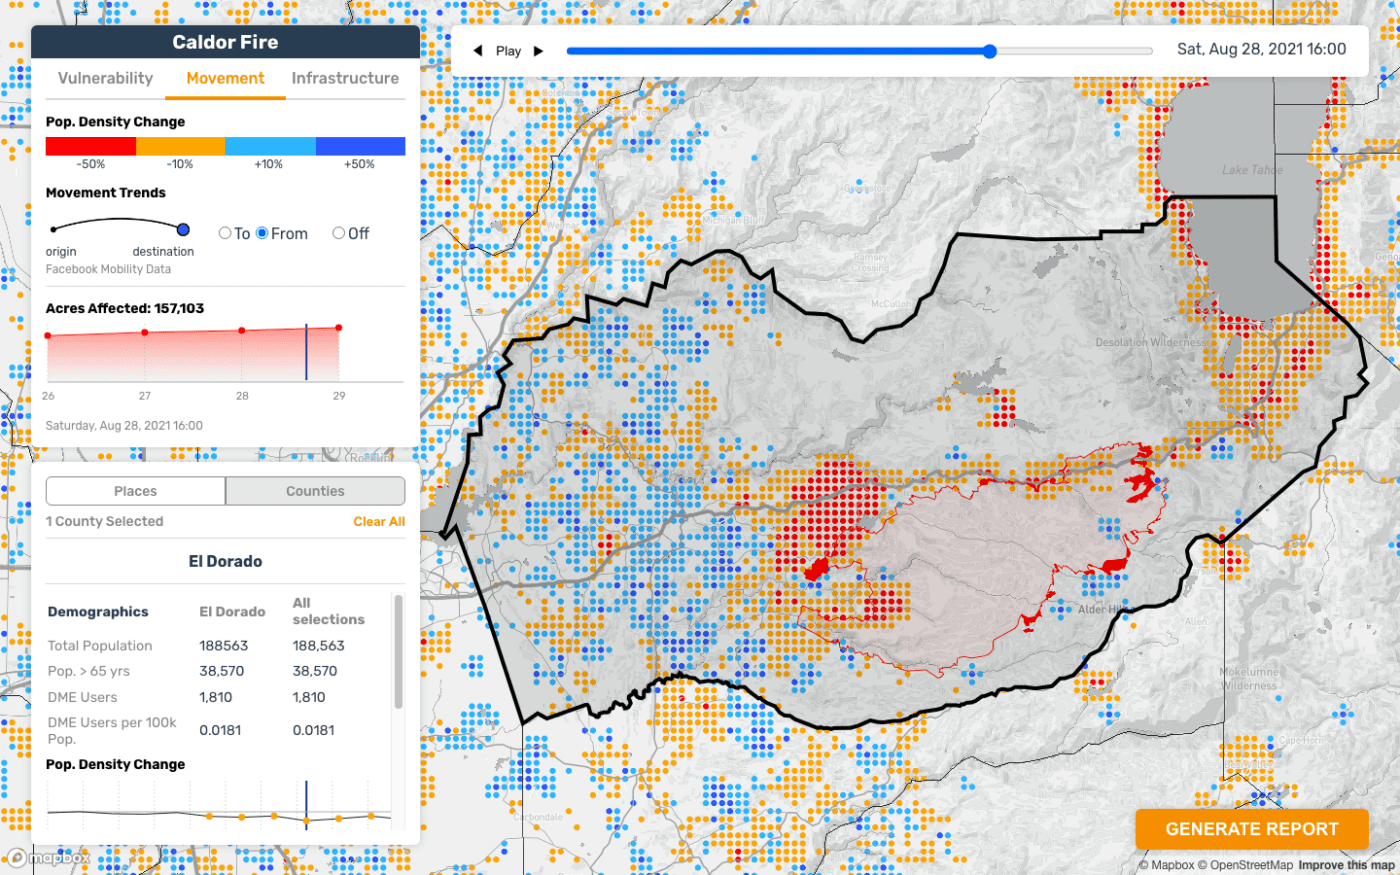
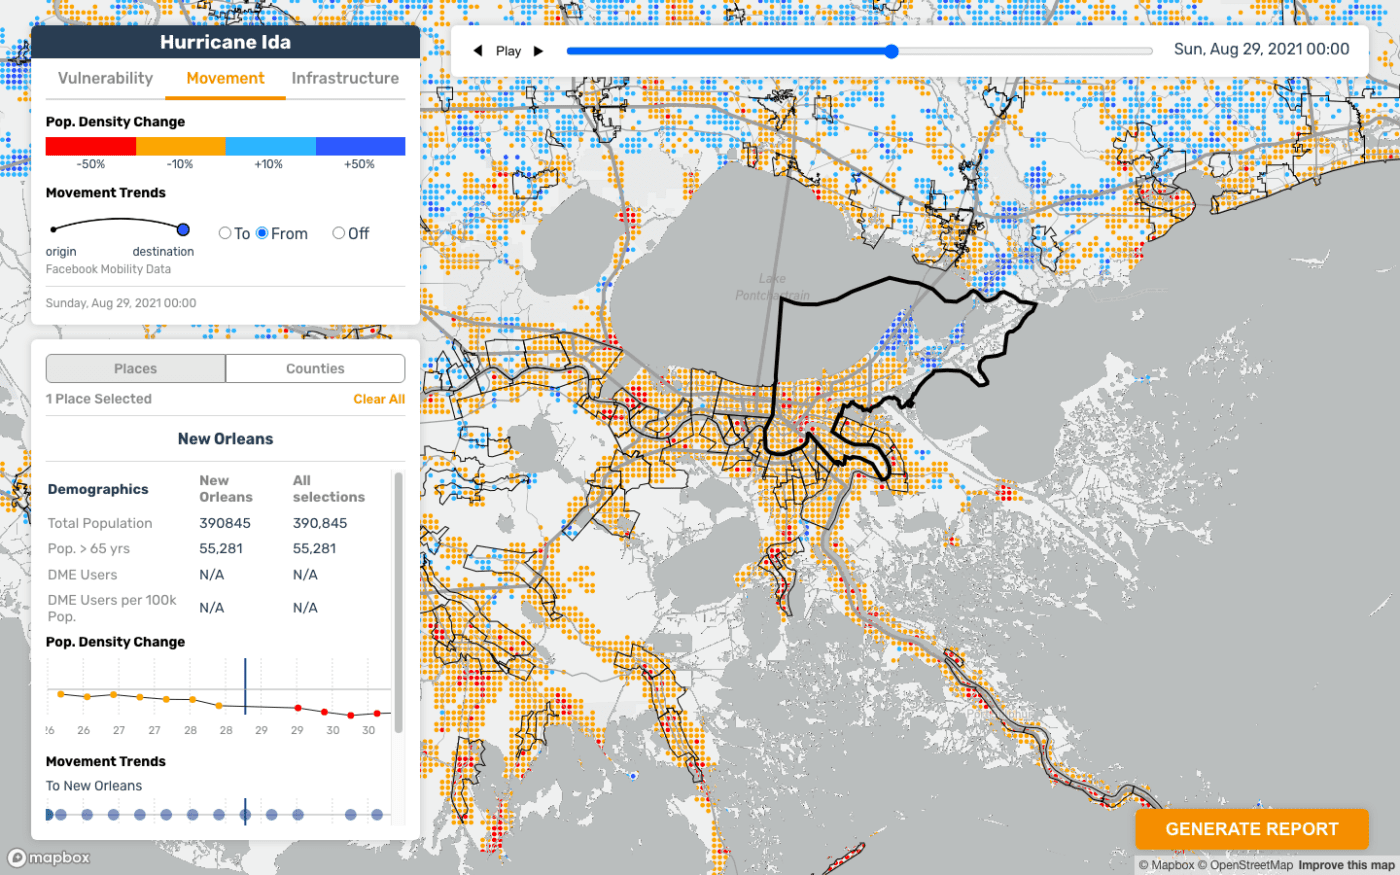
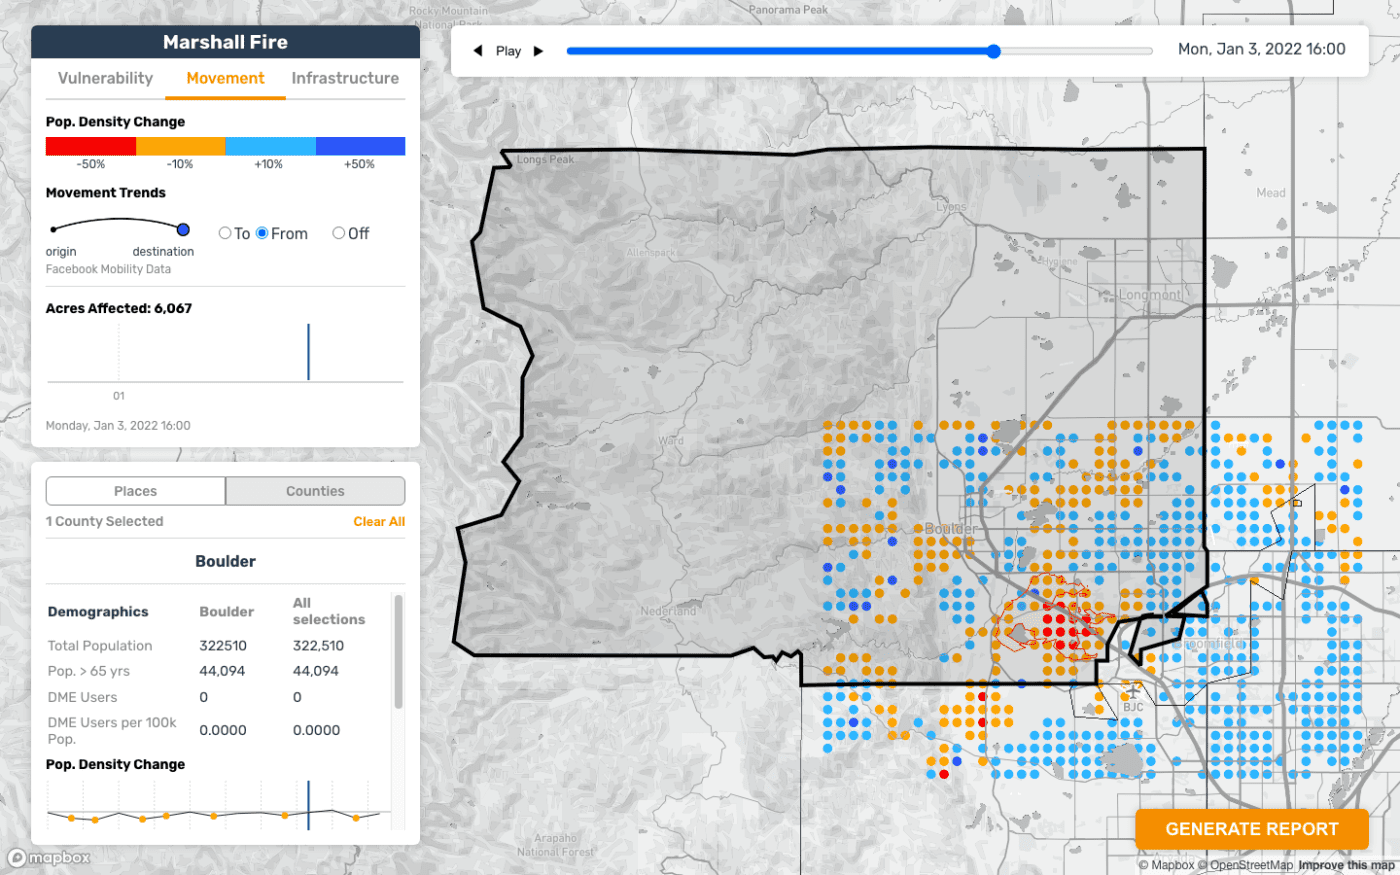
The patterns these data highlight have important implications for the allocation of aid and the anticipation of patient needs at medical facilities during (or after) evacuation activities take place. They also provide important information for response agencies to understand which areas people should move towards to ensure their safety.
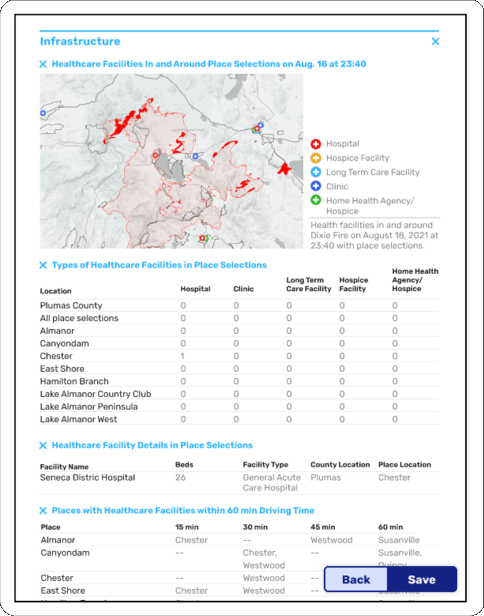
Mapping Healthcare Infrastructure
The third vantage point presents data on healthcare facilities in the areas impacted by an emergency event. The tool maps the locations of a range of primary, secondary, and tertiary healthcare facilities, including long term care facilities, for all regions of the world where data are available. Wherever possible, bed capacity data are also displayed.
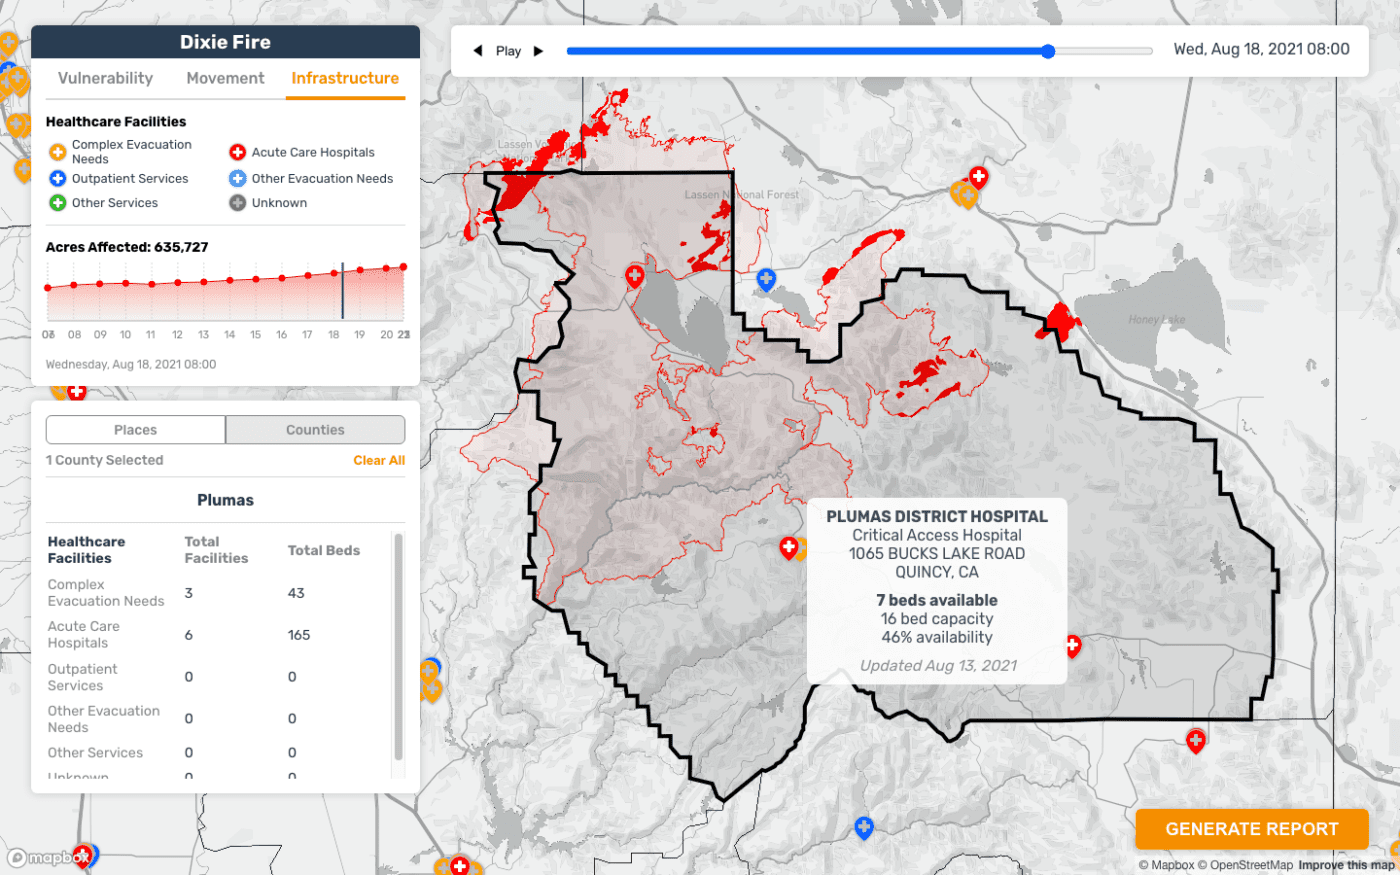
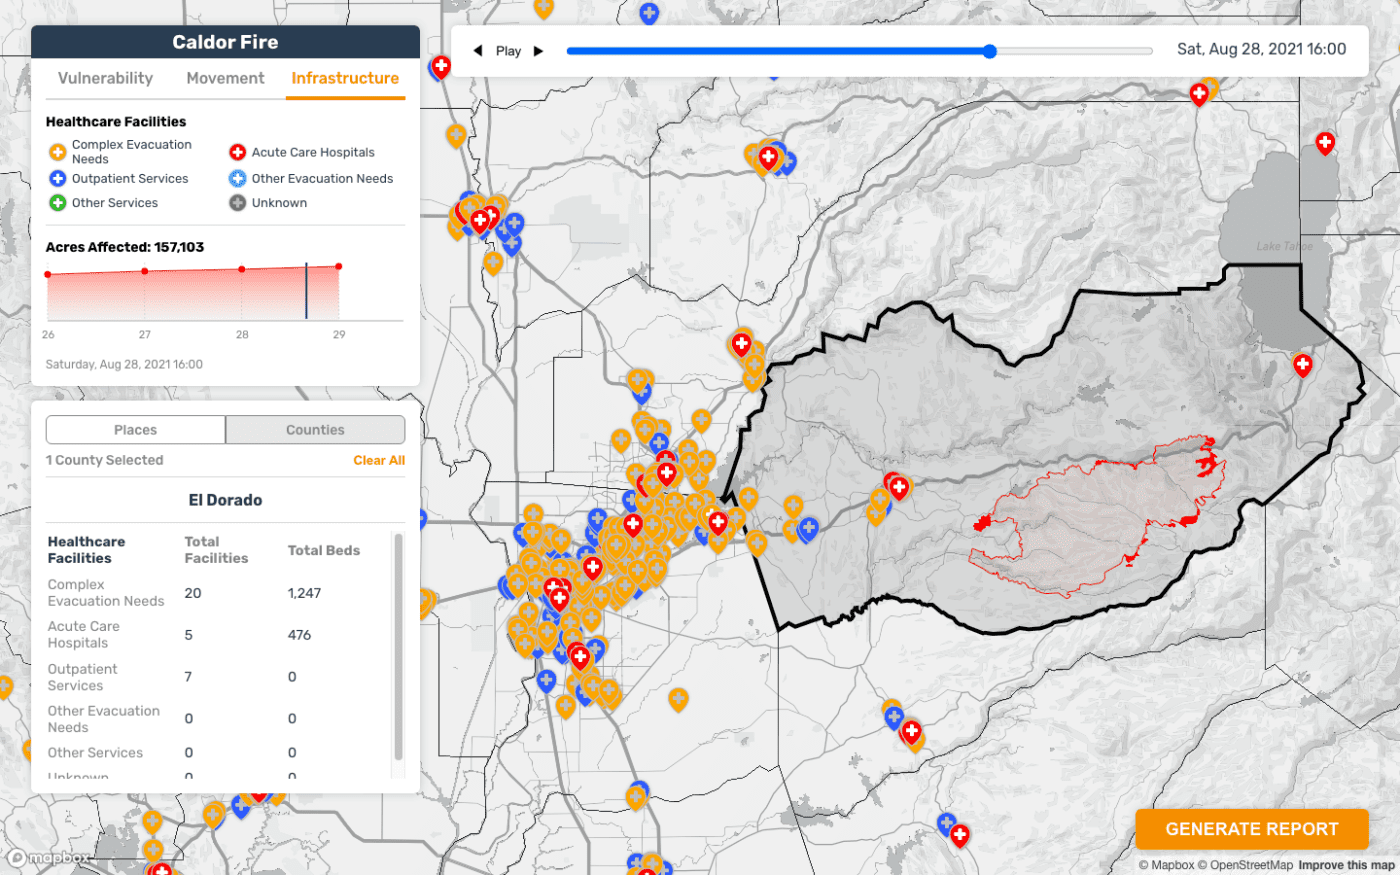
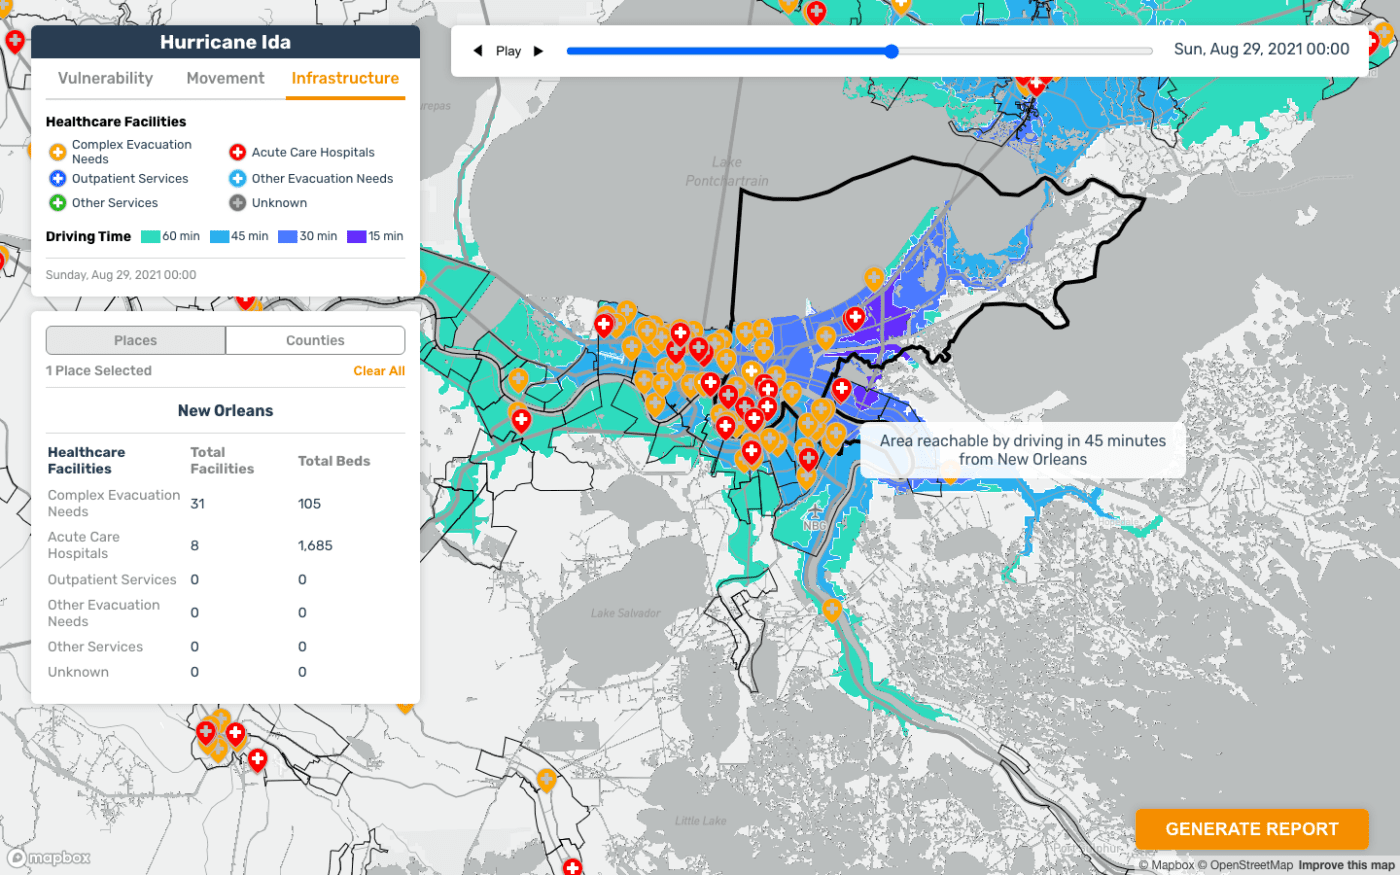
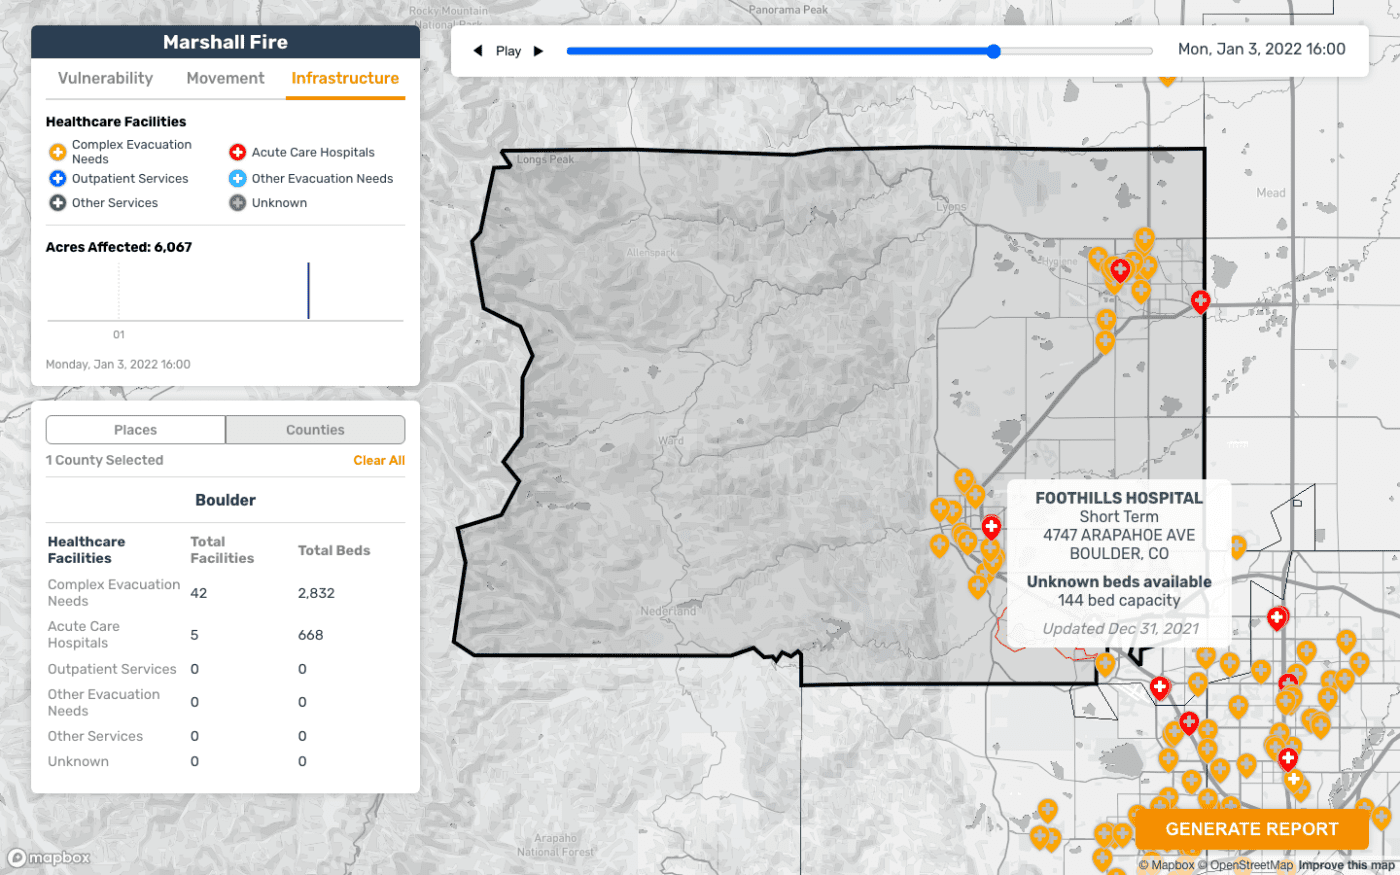
These data provide information on the capacities of nearby healthcare facilities and the disruptions in critical infrastructures (or hazards) that may result in large-scale disaster situations.
Just as routine forecasting for epidemics is an important goal for pandemic preparedness, anticipating both the immediate surge in patients and the longer-term dynamics of the medical needs of communities displaced by a natural disaster ought to become the routine to improve response.
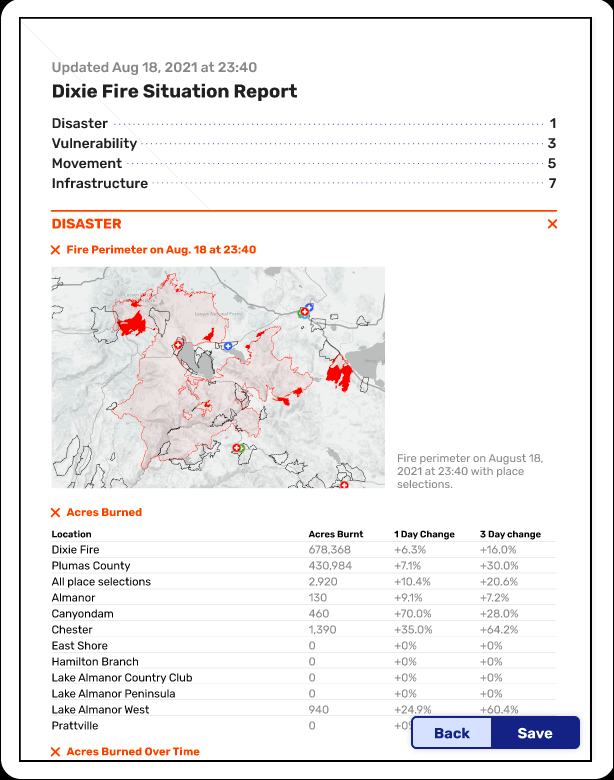
Seamless Report Generation
Customizable reports may be generated in portable document format to provide curated insights that meet specific user needs. Dashboard visualizations can be captured in these reports, filtered by geography, time, and other attributes of interest. The PDFs are modular, allowing users to include or exclude entire sections, and rearrange the flow of information. The digital versions include smart navigation functions. These functions make it easier to organize and share data efficiently.
Video Walkthrough
Below is a recording of a CrisisReady event hosted in May 2022, which features a walkthrough and demonstration of the ReadyMapper tool led by Dr. Satchit Balsari.
The demonstration uses the Dixie Fire as an example, which burned in northern California from July to October 2021.