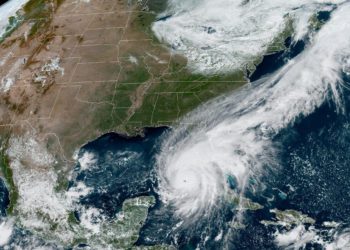
Tropical Storm Claudette made landfall southwest of New Orleans, Louisiana on the 19th of June before moving into the Atlantic on Monday, June 21st. The storm, which caused flooding along the Gulf Coast, is linked to 14 deaths, including 10 children.
As the storm matured over the weekend, Gov. Kay Ivey declared a state of emergency in eight Alabama counties due to the number of incidences of deaths, injuries, power outages and other problems caused by the tropical storm. Efforts are now underway across the coast to assess the damage and seek state and federal help for the affected areas.
CrisisReady analysed population density and network coverage data made available by Facebook’s Data for Good Program for the period from the 17th to the 21st of June to get a better sense of network outages, the state of infrastructure, and the movement of people across the region during the disaster period. These movements manifest in part as changes in the relative densities of population between counties.
Network outages
Overall, network coverage was reduced by 3% across counties over the length of the storm period. The counties with the highest number of days without network coverage were primarily clustered near the coastal belt. Areas of Cameron, Orleans, St. Mary, Jefferson and Plaquemines in Louisiana, along with Jackson County in Alabama, saw the highest number of days without network coverage, averaging around 2-3 days.
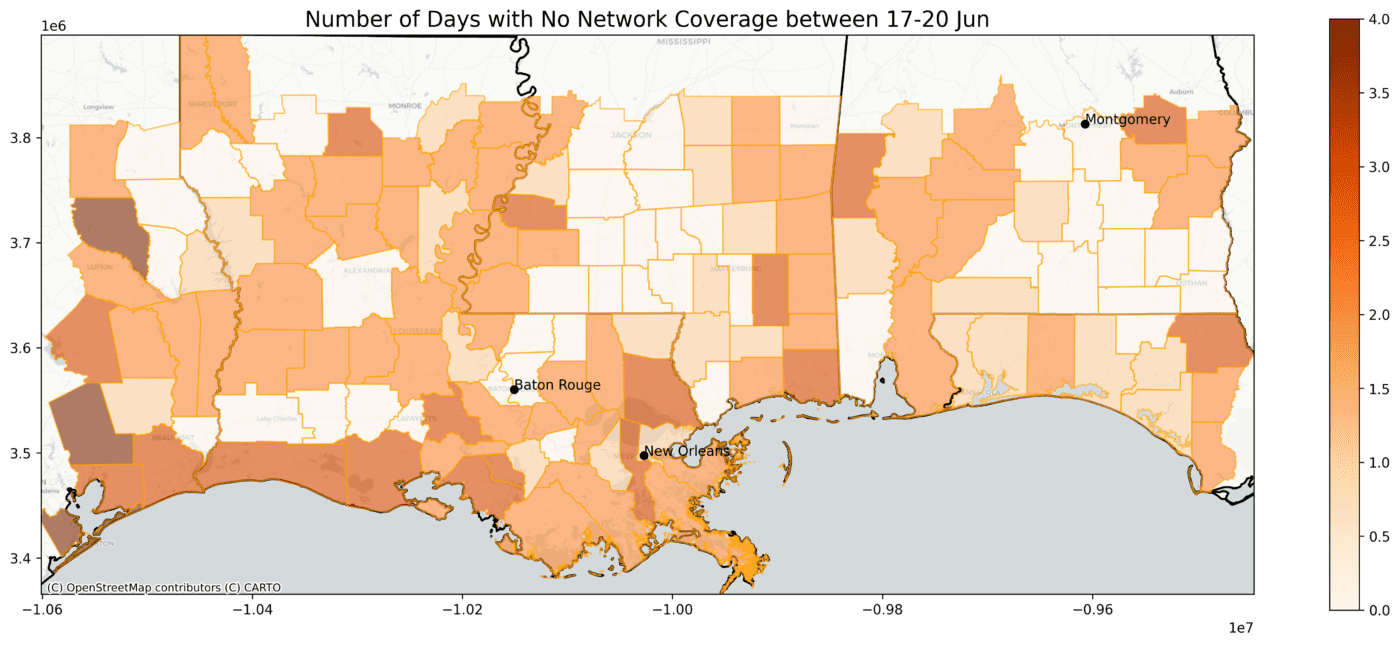
Note: Network Coverage may or may not be directly attributed to the disaster itself and may depend on a number of other factors including whether the cell sites that were used to record the data were used on that particular date or whether there are any facebook users in that location. In order to get the total number of days, we matched the cell sites location that fell within the county maps; the estimated proportion of points with no network coverage within each county ranges from 5-25%.
Population density
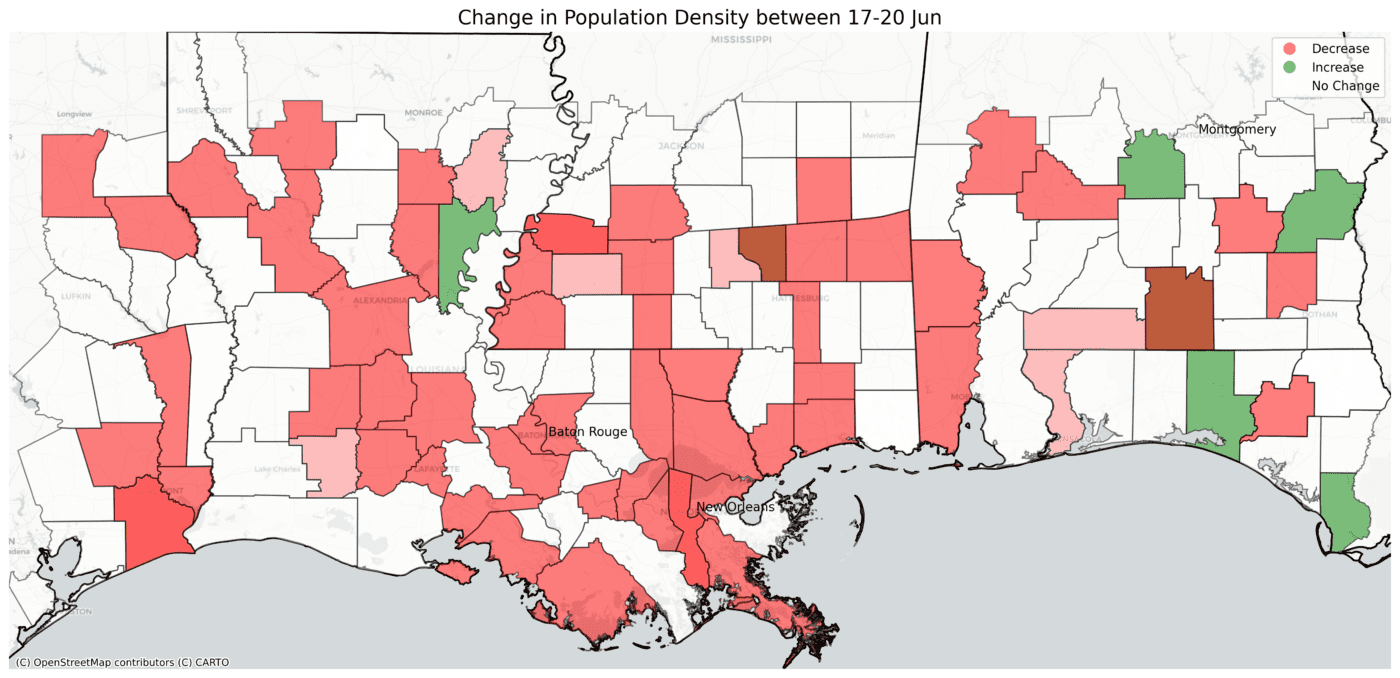
The largest declines in population density occurred in Natchitoches, Orleans and Plaquemine counties in Louisiana with simultaneous increases in Catahoula. For Alabama, we saw the highest declines in population density within Marengo, Wilco, Washington, Mobile, Pike and Dale and increases in Barbour, Walton and Gulf. The population density around these counties was considered to have increased or decreased if the proportion of population during the disaster event was within 2 to 3 standard deviations of the baseline population.
Did network outages correlate with population density change?
Running a Moran’s I bivariate spatial correlation on network coverage and population density, we can see negligible or near-zero correlation between network outages and change in population density during the storm.
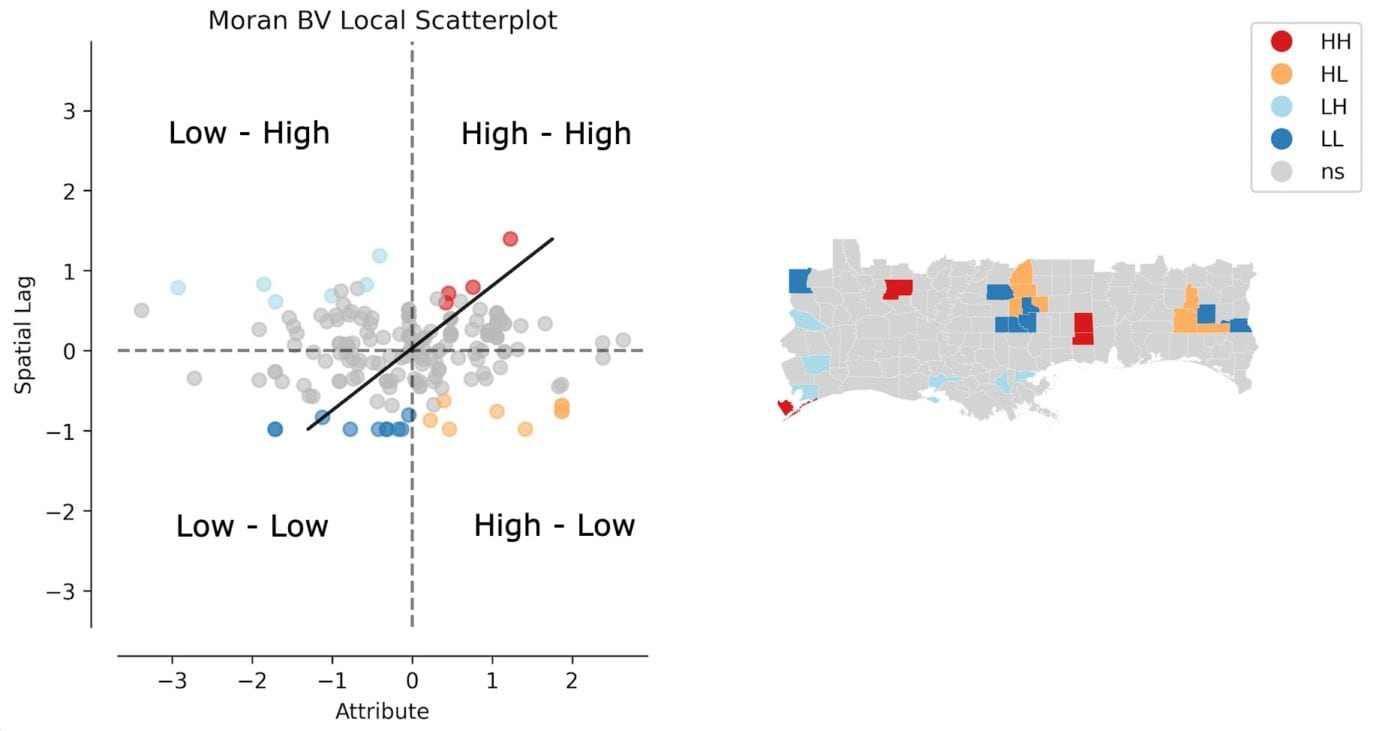
Local autocorrelation plot between network coverage and population density highlighting areas with high-high/high-low/low-high/low-low correlation values at a 0.05 level of significance. The counties in red highlight areas with high network coverage and population density change.
One likely conclusion from the lack of correlation between these two factors is that changes in population density are not due to overall changes in network coverage. This adds to the strength of the conclusion that density change can reasonably be attributed to changes in people’s locations on account of voluntary evacuations from the affected areas.
We do however see a statistically significant local spatial autocorrelation between network coverage and population density with counties such as Iberia, St. Charles, Tangipahoa and St. Mary (marked in red on the map and the plot above), which observed the highest declines in population density and the highest number of days without network.