Abstract
“Official COVID-19 mortality statistics are strongly influenced by local diagnostic capacity, strength of the healthcare and vital registration systems, and death certification criteria and capacity, often resulting in significant undercounting of COVID-19 attributable deaths. Excess mortality, which is defined as the increase in observed death counts compared to a baseline expectation, provides an alternate measure of the mortality shock—both direct and indirect—of the COVID-19 pandemic. Here, we use data from civil death registers from a convenience sample of 90 (of 162) municipalities across the state of Gujarat, India, to estimate the impact of the COVID-19 pandemic on all-cause mortality. Using a model fit to weekly data from January 2019 to February 2020, we estimated excess mortality over the course of the pandemic from March 2020 to April 2021. During this period, the official government data reported 10,098 deaths attributable to COVID-19 for the entire state of Gujarat. We estimated 21,300 [95% CI: 20, 700, 22, 000] excess deaths across these 90 municipalities in this period, representing a 44% [95% CI: 43%, 45%] increase over the expected baseline. The sharpest increase in deaths in our sample was observed in late April 2021, with an estimated 678% [95% CI: 649%, 707%] increase in mortality from expected counts. The 40 to 65 age group experienced the highest increase in mortality relative to the other age groups. We found substantial increases in mortality for males and females. Our excess mortality estimate for these 90 municipalities, representing approximately at least 8% of the population, based on the 2011 census, exceeds the official COVID-19 death count for the entire state of Gujarat, even before the delta wave of the pandemic in India peaked in May 2021. Prior studies have concluded that true pandemic-related mortality in India greatly exceeds official counts. This study, using data directly from the first point of official death registration data recording, provides incontrovertible evidence of the high excess mortality in Gujarat from March 2020 to April 2021.”
Acosta RJ, Patnaik B, Buckee C, Kiang MV, Irizarry RA, Balsari S, et al. (2022) All-cause excess mortality across 90 municipalities in Gujarat, India, during the COVID-19 pandemic (March 2020-April 2021). PLOS Glob Public Health 2(8): e0000824. https://doi.org/10.1371/journal.pgph.0000824
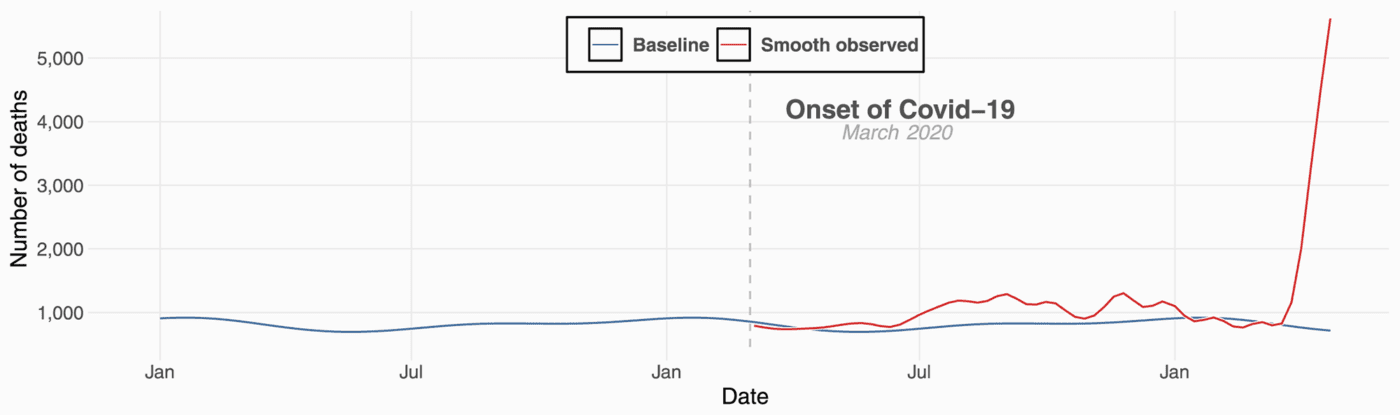
The figure above shows a model fit for weekly death counts amalgamated from multiple municipalities in Gujarat, India. The gray data points are weekly death counts, the dashed-vertical line represents the onset of Covid-19, the blue curve represents the expected weekly death counts based on historical data, and the red curve represents the smooth observed weekly death counts during Covid-19.
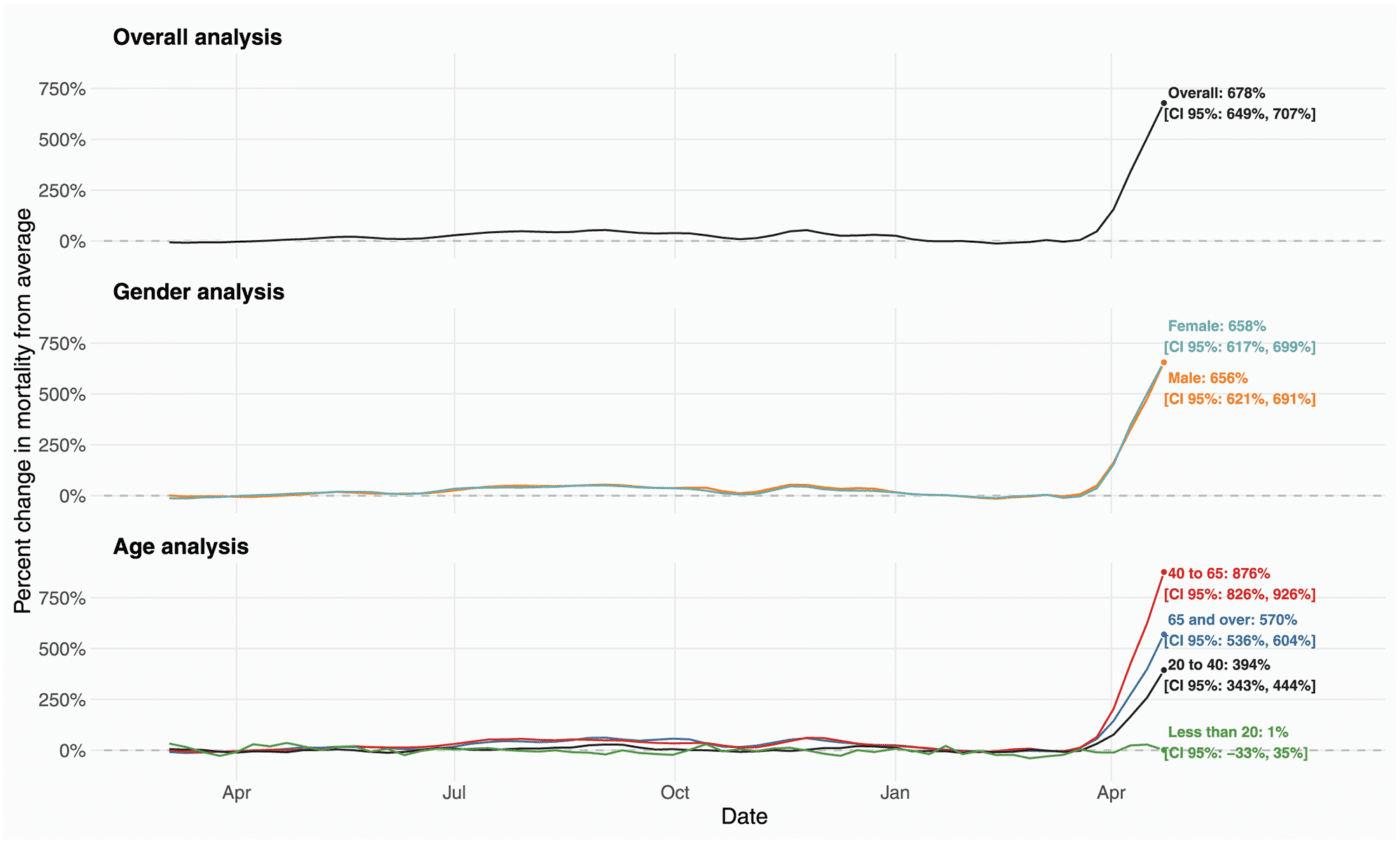
The figure above shows the estimated percent change in mortality from average in Gujarat, India, from March 2020 to April 2021. The solid-curves represent percent changes from average mortality for each group. 95% confidence intervals were omitted for better readability. The point estimate and corresponding 95% confidence intervals for April 16, 2021, the week of peak excess mortality, are displayed in text on the right and highlighted with a data point.
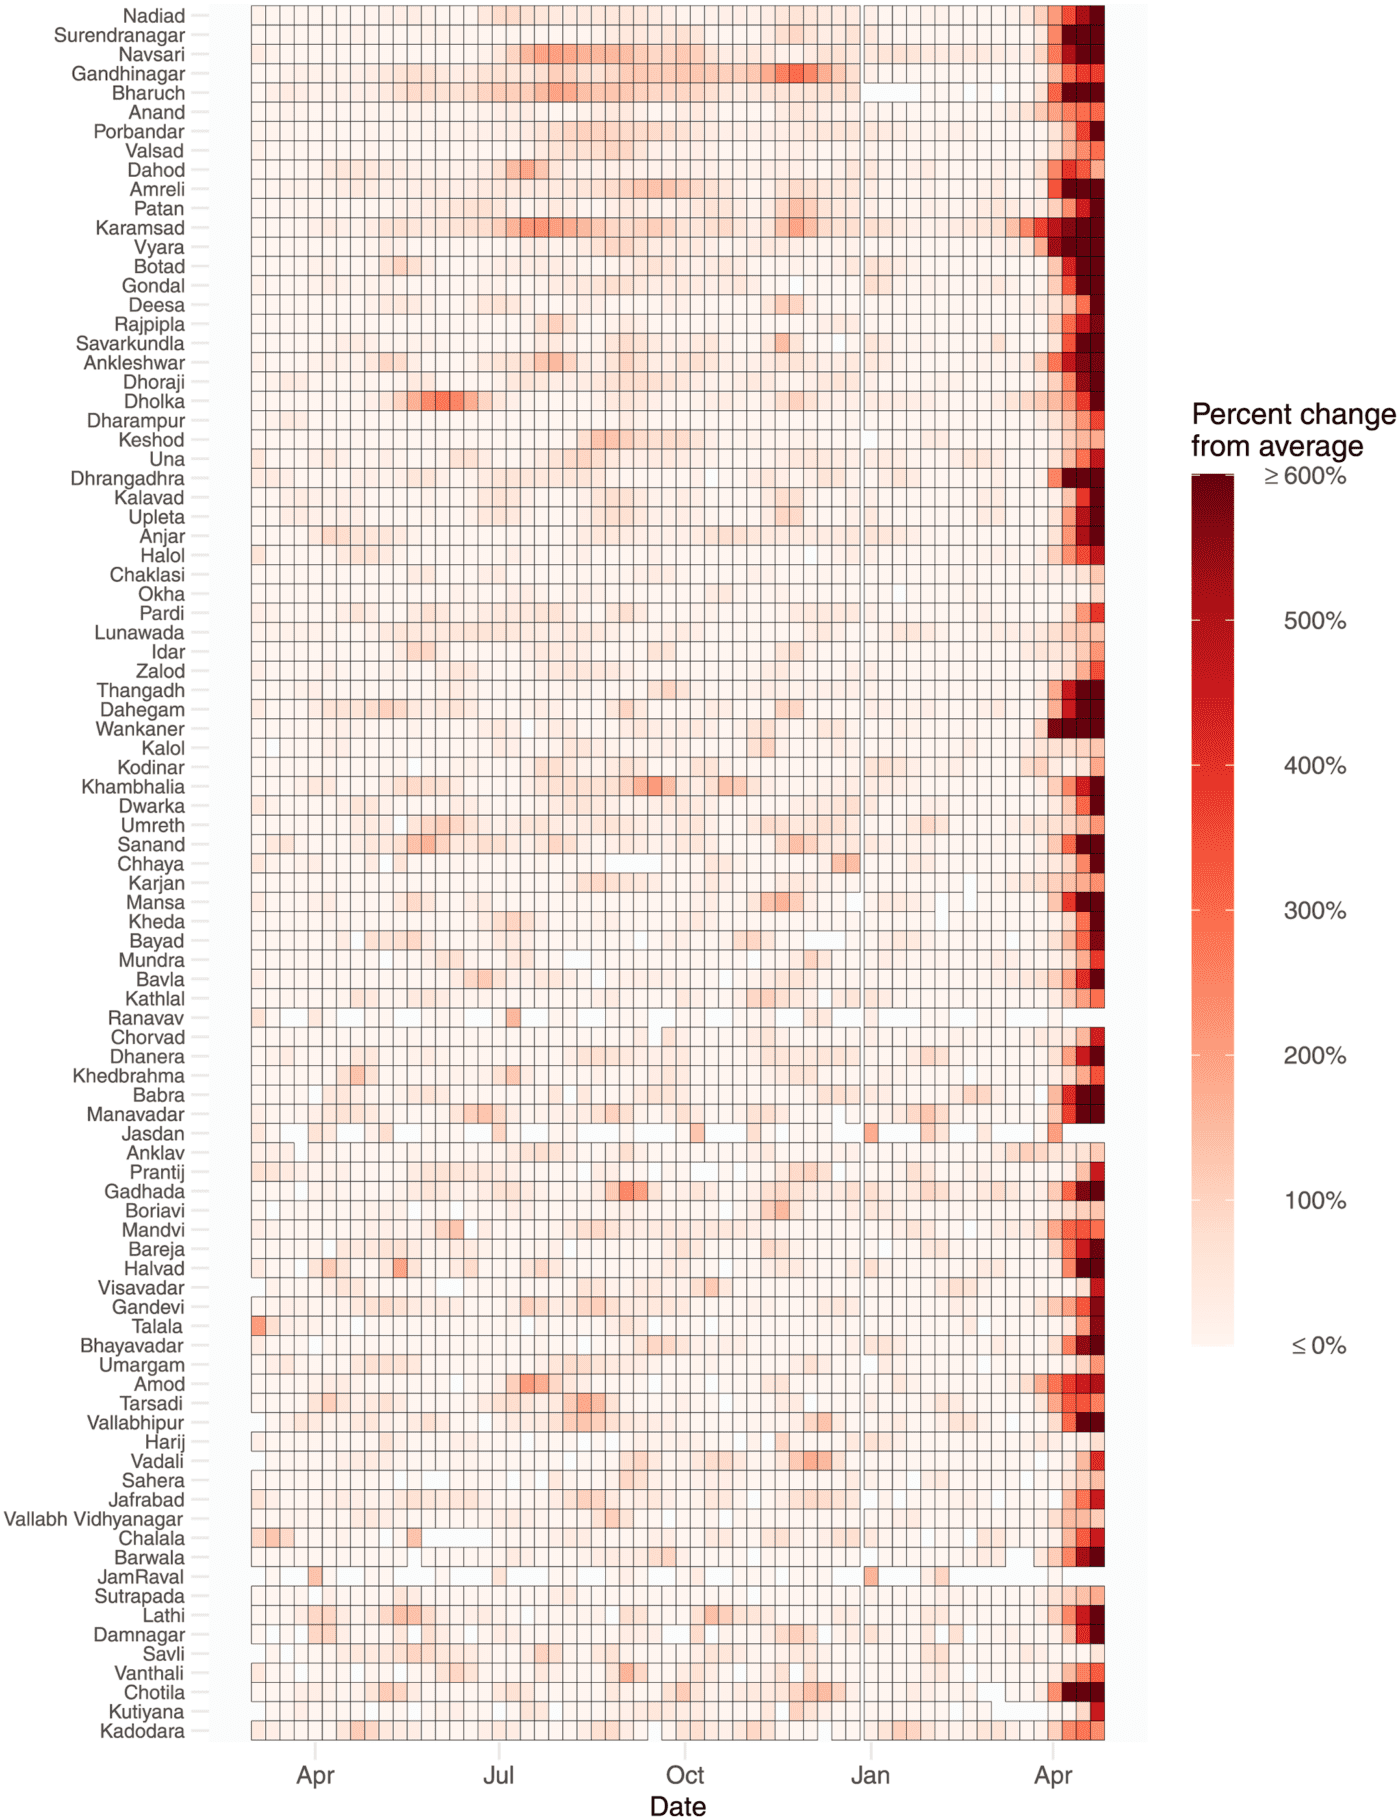
The figure above shows estimated percent increase in mortality in the 90 municipalities, March 2020 to April 2021, from our marginal analysis.