In May 2023, a succession of torrential downpours triggered a series of floods in Italy’s northwestern Emilia-Romagna region. The cities of Bologna, Cesena, Forlì, Faenza, Ravenna, and Rimini bore the brunt of the devastation, experiencing the most significant impact from the storms and subsequent floods.
The first series of floods broke out between May 2nd and 3rd, resulting in the loss of two lives. More devastating floods struck the area between May 16th and 17th, claiming the lives of 15 people. These floods destroyed critical transportation networks throughout the region, displacing approximately 50,000 people and leaving over 36,000 homeless. Many of the displaced were housed by friends and family, while others sought refuge in hotels or temporary shelters.
Climate change has been identified by experts as the underlying factor behind the floods by experts in the country. This Spring, northwestern Italy experienced an extraordinary amount of rainfall, measuring approximately 19.6 inches within a span of 15 days. This amount surpasses more than half of the region’s annual average rainfall.
Environmental conditions were worsened by a prolonged drought that had persisted for several months, making the terrain unable to absorb the deluge. The condition of the soil resulted in the swelling of nearly two dozen rivers, which eventually led to the flooding of streets and farmland with billions of gallons of water.
CrisisReady’s latest situation report provides information on the changes in population densities in northwestern Italy between May 17 and May 31, 2023, when flooding in the region was most severe. The map on the report shows changes in densities on May 31, 2023, at 5:00 a.m. local time.
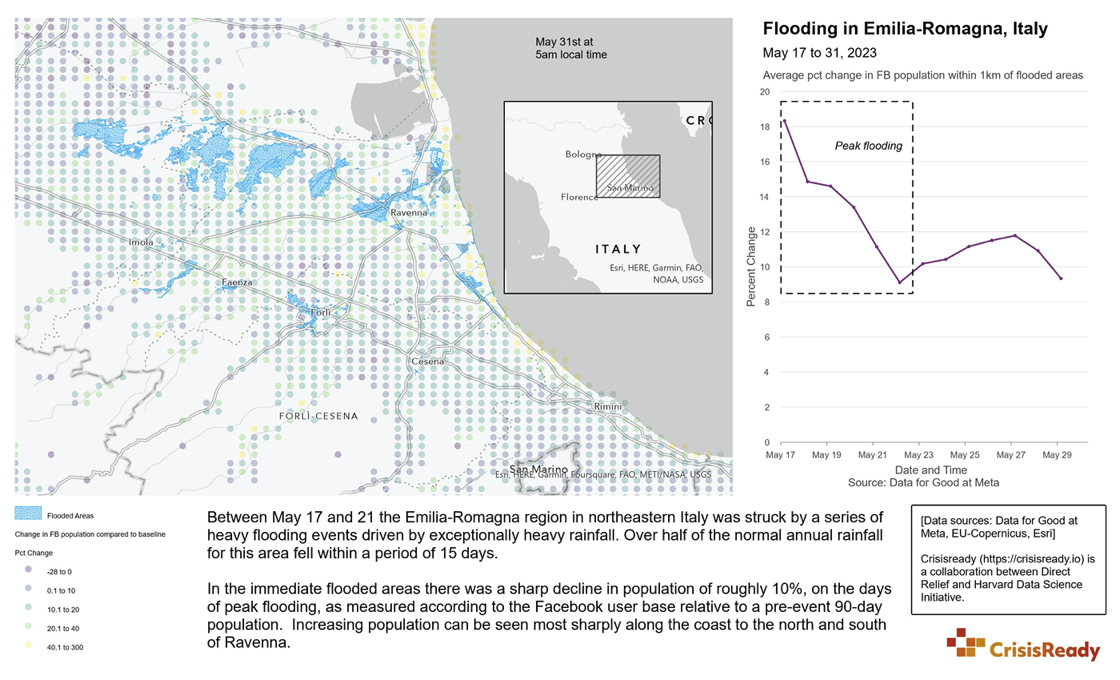
On the days of peak flooding, there was a sharp decrease in population densities of -10% in the areas most affected. Increasing population densities were seen along the northern and southern coasts of Ravenna, a city located just outside the areas immediately affected by the disaster.
Changes in population densities were calculated using mobility data from Data for Good at Meta at the time of analysis compared to baseline values detected 90-days before the incident took place.