A 7.8 magnitude earthquake struck Turkey’s southern Kahramanmaraş province on Monday, February 6 at 4:17 a.m. local time. About nine hours later, a second 7.5 magnitude quake occurred 60 miles north of the initial quake’s epicenter. Mass destruction caused by the quakes has impacted an estimated 23 Million people in Turkey and neighboring Syria. The death toll of the disaster continues to rise exponentially as search and rescue operations continue.
CrisisReady is producing periodic reports in an effort to share new insights on population displacement dynamics as the impacts of the earthquakes in Turkey evolve.
Each report is generated using aggregated mobility data provided by Data for Good at Meta, a program that leverages data to support disaster response around the world. Changes in population densities, which provide signals to population movement, were determined by calculating the percent difference between the number of users on Meta applications during the time of analysis compared to baseline values recorded 90-days before the earthquakes struck. Data from United States Geological Survey (USGS) and ESRI are also used in the reports.
Data Updates
All CrisisReady data reports can be found on ReliefWeb. CrisisReady’s organization page can be found here.
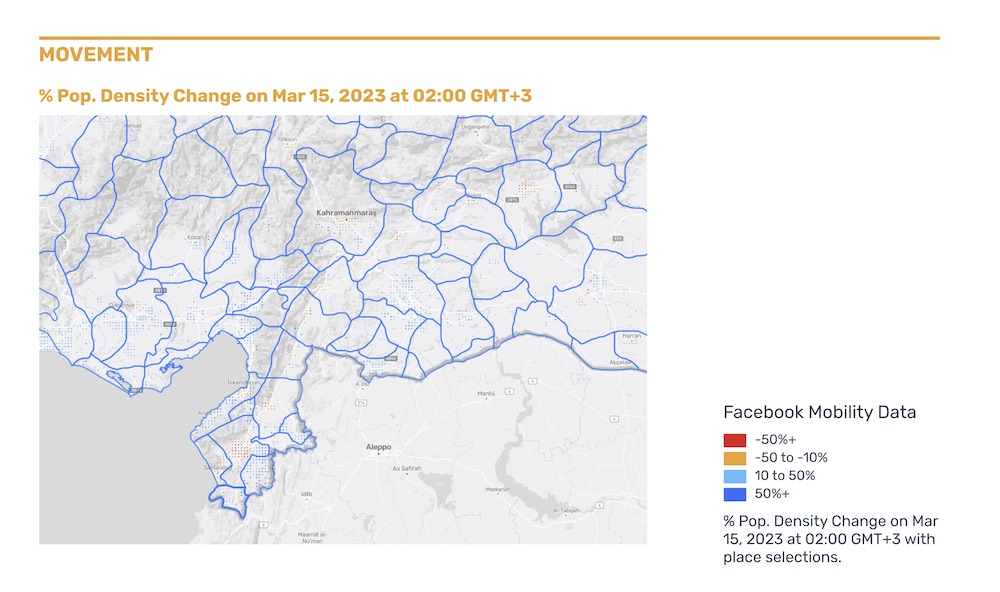
Wed, March 15, 2023
Southern Turkey | 11:00 a.m. GMT+3
This report provides information on population density changes registered as of Wednesday, March 15 at 11:00 a.m. local time in southern Turkey, near the border of Syria.
Key Observations
- Displacement dynamics across southern Turkey have largely stabilized over the past week, with only minor rates of population density change being registered.
- The two cities seeing the greatest reductions are Malatya (-58%) and Antakya/Hatay (-60%).
- Kahramanmaraş, İslahiye, İskenderun, and Kırıkhan are gradually returning to baseline population values, but still remain well-below pre-crisis numbers.
- Reductions in these areas range from -17% to -37%.
- Cities seeing the greatest rates of increase are the following:
- Altınözü: +51%
- Kumlu: +38%
- Kilis: +27%
- Nizip: +26%
- Kadirli: +23%
- Şahinbey: +18%
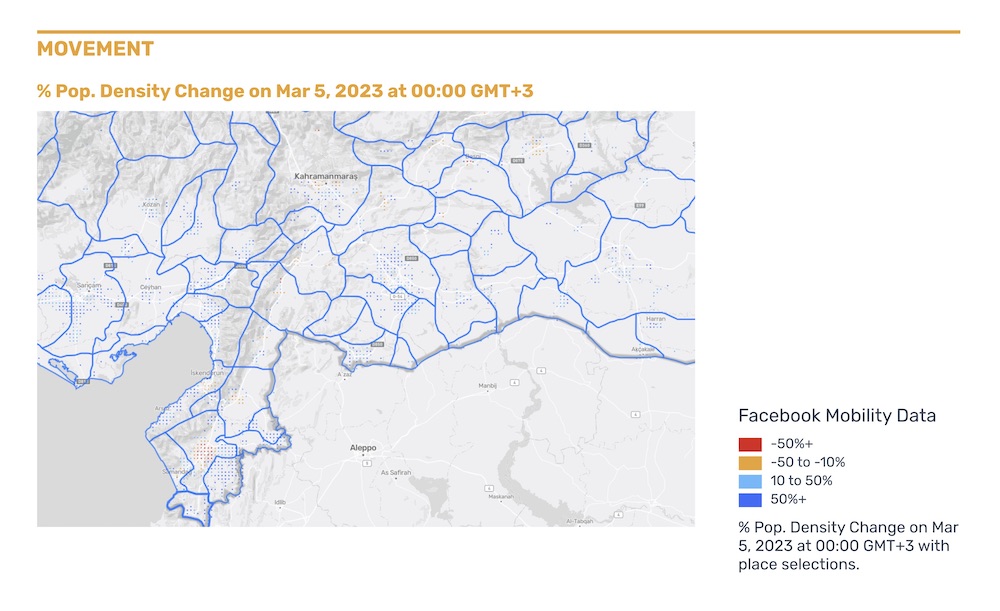
Sun, March 5, 2023
Southern Turkey | 8:00 a.m. GMT+3
This report provides information on population density changes registered on Sunday, March 5 at 8:00 a.m. local time in southern Turkey, near the border of Syria.
Key Observations
- The four most-affected provinces in Turkey — Hatay, Adıyaman, Kahramanmaraş, and Malatya — remain below baseline population densities by a variance of -7% to -44%.
- Significantly greater rates of population decrease were recorded in the main cities within each areas.
- Hatay as a province records a lower rate of population decrease than the city of Antakya (-51%) due to the high rate of displacement to the east and west of the city.
- All other provinces bordering the principal epicenter of the earthquake continue to show substantial population increases between +15% and +45%, with the highest proximate city-level rates occurring in:
- Altınözü: +81%
- Kumlu: +63%
- Erzin: +55%
- Reyhanlı: +48%
- Mersin: +33%
- The town of Samandağ, which in addition to the initial 7.8 magnitude earthquake was struck by a 6.3 magnitude aftershock on February 20, has nearly returned to its baseline population density.
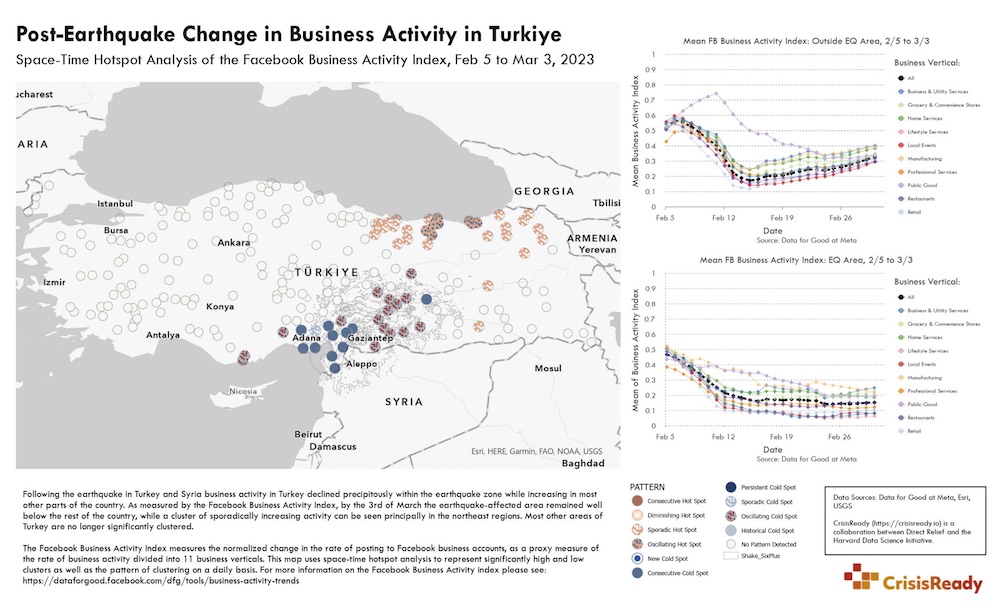
Fri, March 3, 2023
Turkey, Nation-Wide | Feb 5 – Mar 3
This report provides an overview of post-earthquake changes in business activity across Turkey.
The report was generated by conducting a space-time hotspot analysis of the Facebook Business Activity Index between Sunday, February 5 — a day before the initial earthquake struck — and Friday, March 3.
The Index measures the normalized change in the rate of posting to Facebook business accounts, as a proxy measure of the rate of business activity divided into 11 business verticals. This report shows significantly high and low clusters of business activity as well as the pattern of clustering on a daily basis.
Key Observations
- Business activity declined significantly within the earthquake zone while increasing in most other parts of the country.
- By March 3, business activity in the earthquake-affected areas remained well below the rest of the country, while a cluster of sporadically increasing activity was seen in the northeast.
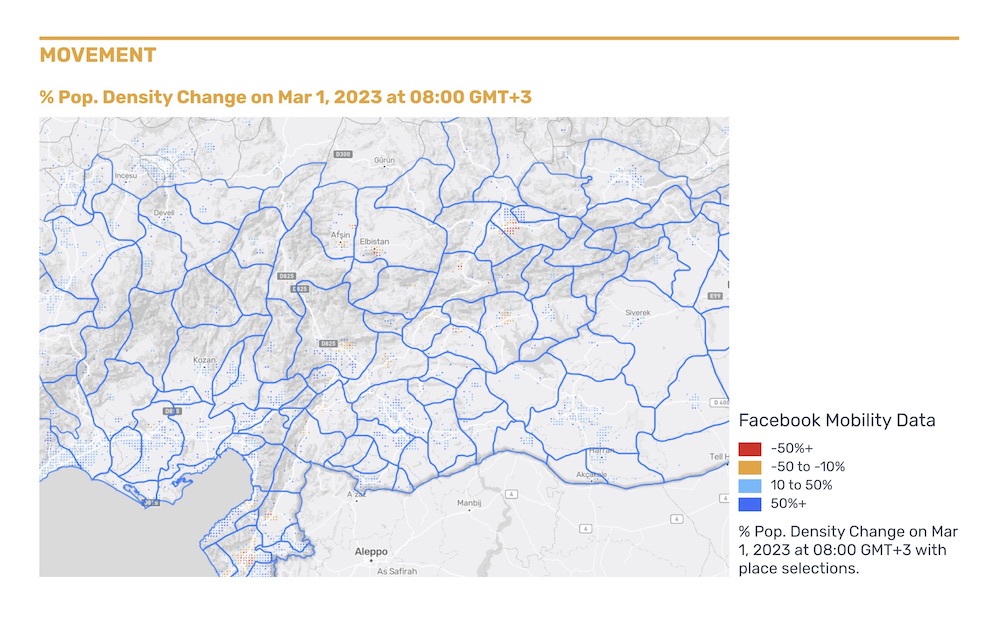
Wed, March 1, 2023
Southern Turkey | 8:00 a.m. GMT+3
This report provides information on population density changes on Wednesday, March 1, at 8:00 a.m. local time in southern Turkey, near the border of Syria.
Key Observations
- The four most-affected provinces of Adıyaman, Hatay, Kahramanmaraş, and Malatya remain significantly below baseline population, ranging from -16% to -42%.
- These decreases have remained stable for several days now, with cities in the most-affected areas registering slow (to zero) rates of change.
- Every province outside of the most-affected areas is registering significant rates of increase – from 14% in Nevsehir to 34% in Kilis.
- Three large cities — Şehitkamil, Yüreğir, and Mersin — registered population increases ranging from +18% to +26%.
- Similarly, the cities of Sanhufra, Seyhan, and Şahinbey saw increases in population densities between +15% and +22%.
Mon, February 27, 2023 | Data Report Feature
Data Report Feature: “Secondary Data Review (SDR), Turkey Earthquakes – Shelter & Displacement,” International Federation of Red Cross And Red Crescent Societies (IFRC)
Insights from CrisisReady’s report comparing population density changes between February 5 and February 26 in Turkey was featured in a situational update published by the IFRC. The report focuses on updated displacement and shelter data in the region.
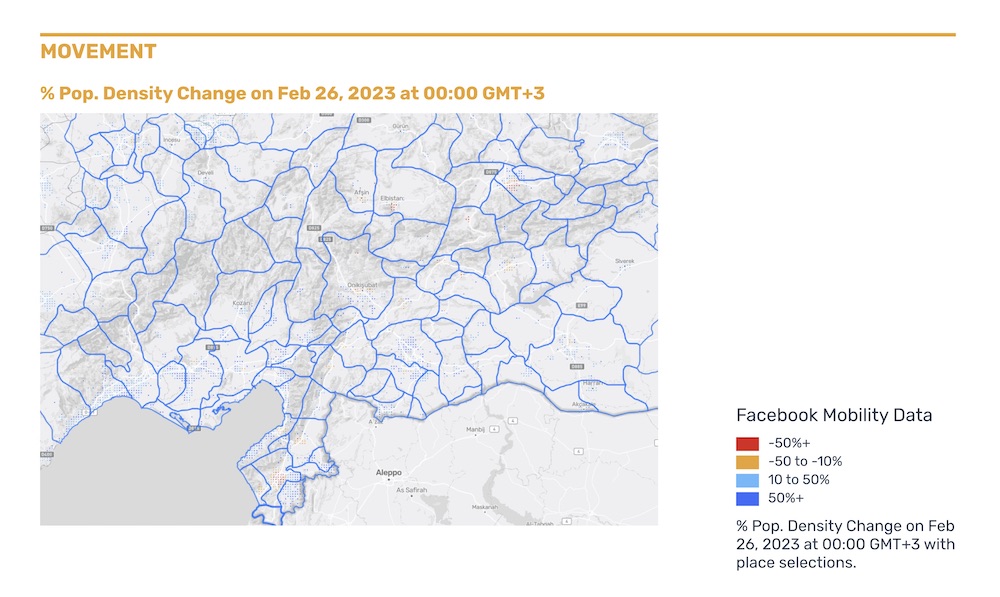
Sun, February 26, 2023
Southern Turkey/Syrian Border | 8:00 a.m. GMT+3
This report provides information on population density changes on Sunday, February 26, at 08:00 GMT+3 in southern Turkey, near the border of Syria.
Key Observations
- Although the population densities of Hatay, Adıyaman, Kahramanmaraş, and Malatya remain well below baseline — ranging from -12% to -41% — virtually all other provinces are showing substantial increases in densities.
- Mersin, Kayseri, Diyarbakır, Gaziantep, and others show increases up by +19% to +34% as of the morning of February 26.
- Nevşehir, Elâzığ, Yüreğir to Erzin and Kumlu show increases in population densities ranging from +18% to +65%.
- The Facebook population sample varies between 2% and 11% at the city level.
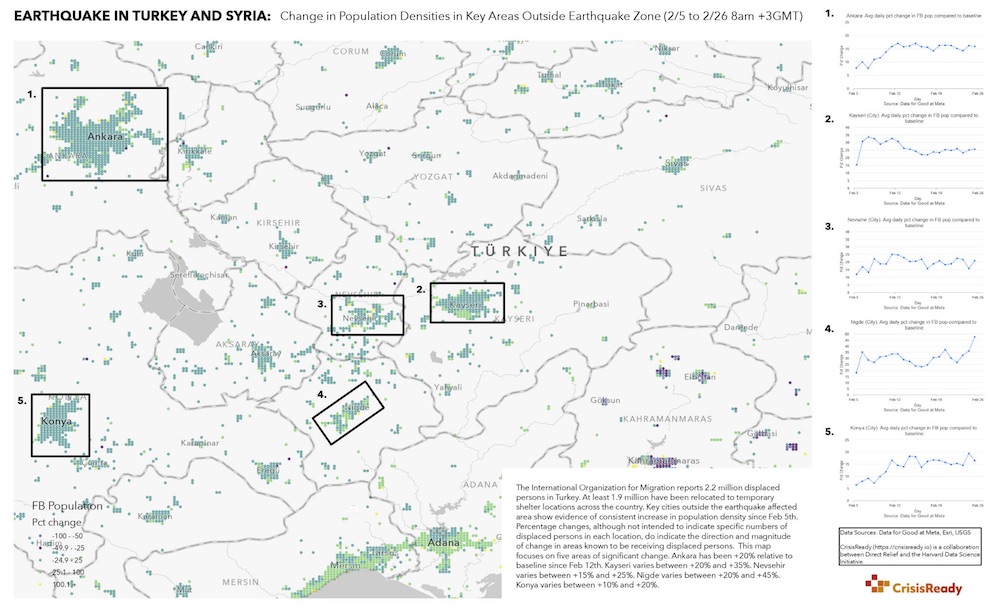
Sun, February 5 – Sun, February 26, 2023
Turkey | 08:00 a.m. GMT+3
This report provides a comparison of population density changes between Sunday, February 5 – Sunday, February 26, at 08:00 a.m. local time in Turkey.
Key Observations
- Key cities outside the earthquake-affected areas — including Ankara, Kayseri, Nevşehir, Niğde, and Konya — show consistent increases in population densities since Sunday, February 5.
- Ankara: consistent +20% increase (since Feb 12)
- Kayseri: +20% – +35% increase (since Feb 5)
- Nevşehir: +15% – +25% increase (since Feb 5)
- Niğde: +20% – +45% increase (since Feb 5)
- Konya: +10% – +20% increase (since Feb 5)
- Percent changes, although not intended to indicate specific numbers of displaced person in each location, indicate the direction and magnitude of change in areas known to be receiving a high volume of displaced persons.
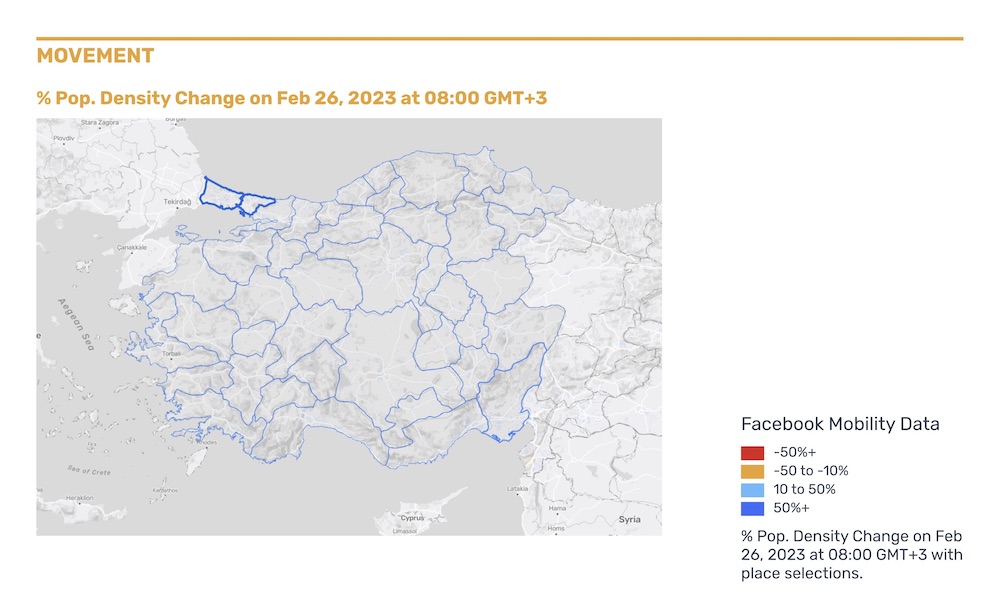
Sun, February 26, 2023
Western Turkey | 08:00 a.m. GMT+3
This report provides information on population density changes recorded on Sunday, February 26, at 08:00 GMT+3 in western Turkey.
Key Observations
- Current data indicates that there is an estimated 2.2 million people displaced in Turkey, following the earthquakes and aftershocks that struck the country earlier this month.
- 1.9 million people in Turkey are being housed in tents or temporary shelters, and nearly 530,000 have been relocated outside the affected areas.
- As of the morning of February 26, virtually all of western Turkey — outside the areas most affected by the earthquakes — showed increasing population densities.
- The greatest increases in population densities were in Mersin (+26%), Niğde (+19%), and Adana (+15%).
- Although the province of Istanbul only showed an increase of +4% at the time of analysis, the capital city shows the highest overall gains in population due to the already high population.
- Population may be unevenly distributed throughout the metropolitan area.
Fri, February 24, 2023 | Data Report Feature
Data Report Feature: “Türkiye Earthquake February 2023, Bi-weekly Highlights – 24/02/2023,” Data Friendly Space, International Federation of Red Cross And Red Crescent Societies (IFRC)
Insights from CrisisReady’s report on population density changes in Turkey recorded on Monday, February 20 was featured in a bi-weekly situational update published by Data Friendly Space and the IFRC.
Tues, February 21, 2023 | Data Report Feature
Data Report Feature: “Türkiye Earthquake February 2023, Bi-weekly Highlights – 21/02/2023,” Data Friendly Space, International Federation of Red Cross And Red Crescent Societies (IFRC)
Insights from multiple CrisisReady reports — published between February 13 – February 17 — were featured in a situational update published by Data Friendly Space and the IFRC. The report focuses on updated displacement data in the most hard-hit areas of Turkey.
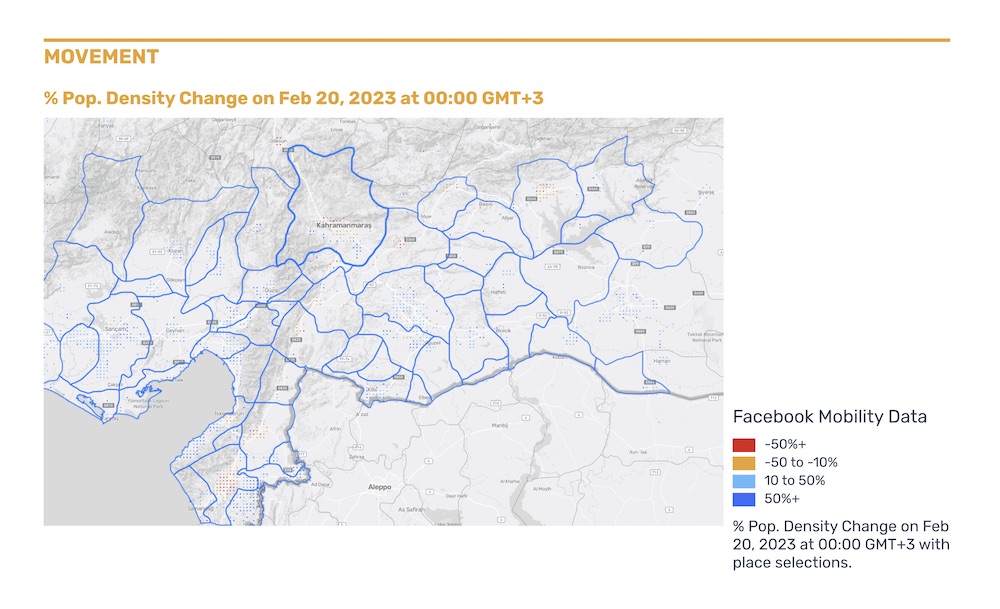
Mon, February 20, 2023
Southern Turkey | 00:00 GMT+3
This report provides information on population density changes recorded on Monday, February 20, at 8:00 a.m. local time in the regions most impacted by the earthquakes in Turkey.
Key Observations
- As of Monday, February 20, several areas that had previously shown stark declines in population densities after the earthquake were showing increasing trends, returning towards baseline population values.
- The government of Turkey currently estimates that 384,500 housing units have been destroyed by the quakes and subsequent aftershocks.
- The International Organization for Migration (IOM) estimates that over 13 million people may have been displaced.
- According to data from Data for Good at Meta, while many areas of the most heavily-affected zones in Kahramanmaraş, Adiyaman, and Hatay continues. to see severely reduced proportions of population between -24% and -38%.
- Several cities, including Sahinbey, Birecik, Sumbas, Dortyol, Hassa, Osmaniye, and Turkoglu are now registering population densities above baseline.
- The areas of greatest reduction continue to be the cities of Iskenderun, Kahramanmaraş, and Hatay, which remains more than two-thirds reduces relative to baseline more than two weeks after the quake.
- Representativeness of the Facebook mobility data remains between 2% and 11% in the cities included in the analysis.
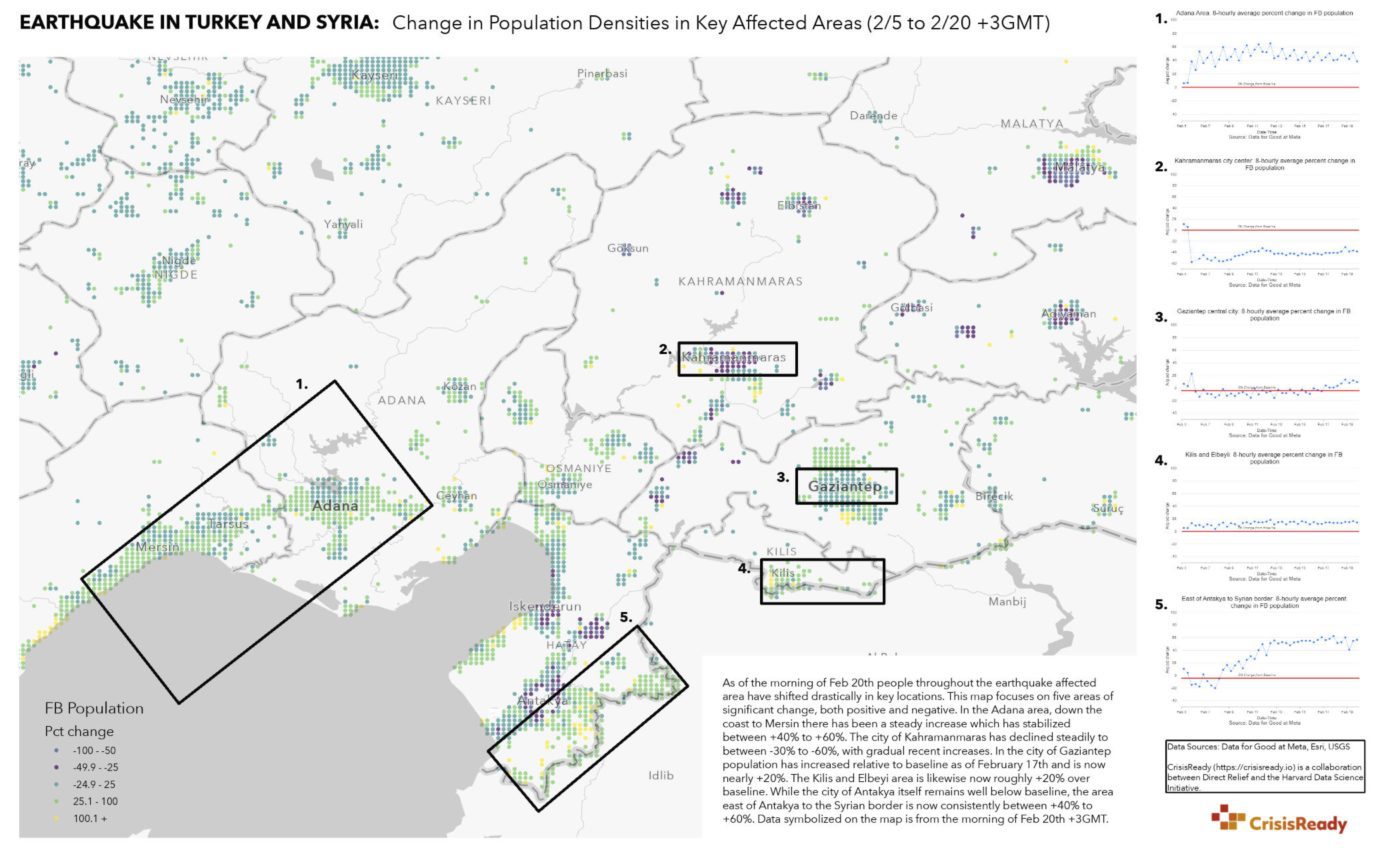
Mon, February 20, 2023
Adana, Kahramanmaraş, Gaziantep, Kilis, Antakya, Turkey | 00:00 GMT+3
This single-page report provides information on population density changes recorded on Monday, February 20, at 8:00 a.m. local time in Adana, Kahramanmaraş, Gaziantep, Kilis, and Antakya, Turkey.
Key Observations
- As of the morning of Monday, February 20, populations throughout the areas most affected by the earthquake on Feb 6 have shifted dramatically in key locations. This report focuses on five areas of significant change, both positive and negative: Adana, Kahramanmaraş, Gaziantep, Kilis, and Antakya.
- In the Adana area, there has been a steady incline of population densities down the coast of Mersin.
- Increases in population densities have stabilized between +40% and +60%.
- The city of Kahramanmaraş has shown steady declines in population density, ranging between -30% to -60%, with gradual recent inclines.
- In the city of Gaziantep, population densities have increased nearly +20% since the last report on Friday, February 17.
- The Kilis and Elbeyli areas also registered around a +20% incline in population densities over baseline values.
- The city of Antakya remained well below baseline at the time of analysis — however, the area east of Antakya, close to the Syrian border, is now showing consistent inclines between +40% and +60%.
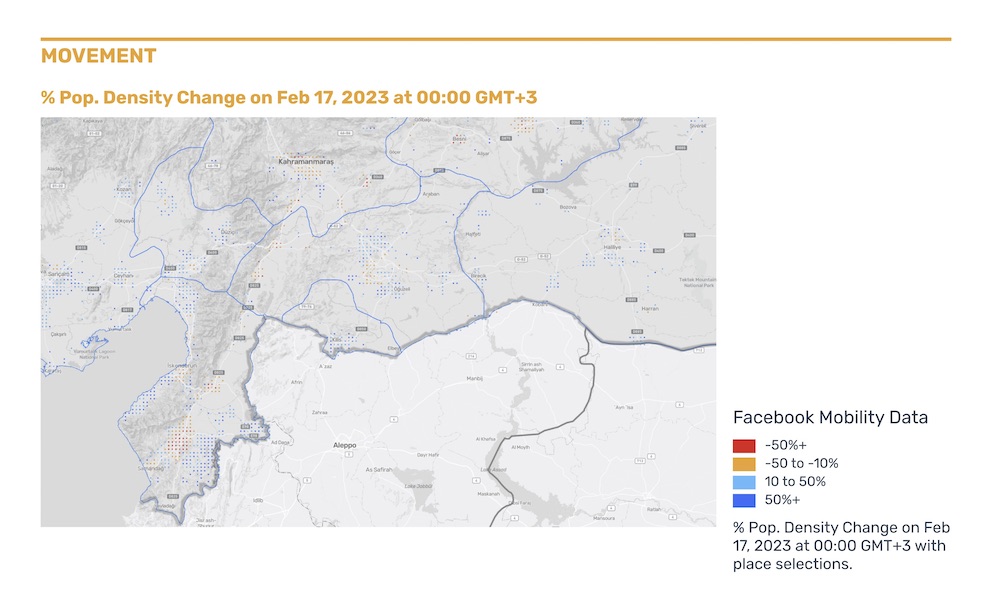
Fri, February 17, 2023
Turkey | 00:00 GMT+3
This report provides information on population density changes recorded on Friday, February 17, at 8:00 a.m. GMT+3 in the regions most impacted by the earthquakes in Turkey.
Key Observations
- For the 11 provinces that the Turkish government has named the principal affected areas of the earthquake, six are now seeing above-baseline population densities and five continue to see significant declines in densities.
- The six provinces registering consistent increases in population densities include Kilis, Elazig, Adana, Diyarbakir, Sanliurfa, and Osmaniye.
- These six provinces showed inclines ranging from 7% to 35%.
- The five provinces registering consistent declines in population densities includes Gaziantep, Hatay, Adiyaman, Kahramanmaraş, and Malatya.
- These five provinces showed declines ranging from -2% to -49%.
- Facebook’s data represents an overall 3% sample of the populations of the 11 affected provinces. This value ranges from a low of 1.2% in Diyarbakir and 1.9% in Sanliurfa, to highs of 4.6% in Adana and 5.1% in Kilis.
Thurs, February 16, 2023
Turkey | 7:00 a.m. GMT+3
This report provides information on population density changes recorded on Thursday, February 16 at 7:00 a.m. local time in the regions most impacted by the earthquakes in Turkey.
Key Observations
- On the morning of Monday, February 13, baseline Facebook population values in Hatay province were just over 71,0000; on February 16, the baseline values in the same area exceeded to 107,000, with crisis totals just under 80,000.
- This shift has only had a minor effect on percent changes from baseline population values, though.
- Most of the increases in population densities in Hatay occurred outside the city of Antakya, which is in the Hatay admin 2 boundary.
- This reflects increasing movement between cities and towns.
- Significant increases in population densities are also evident between Antakya and the Syrian border.
- The only provinces in the affected area that showed substantial decreases in population densities are the most-affected areas of Hatay, Malatya, Kahramanmaraş, Adiyaman, and Gaziantep.
- All other provinces show increasing population totals and percentage changes.
- Directional trends from prior reports remain largely unchanged in regards to returns to baseline and persistence of above- or below baselines percentages
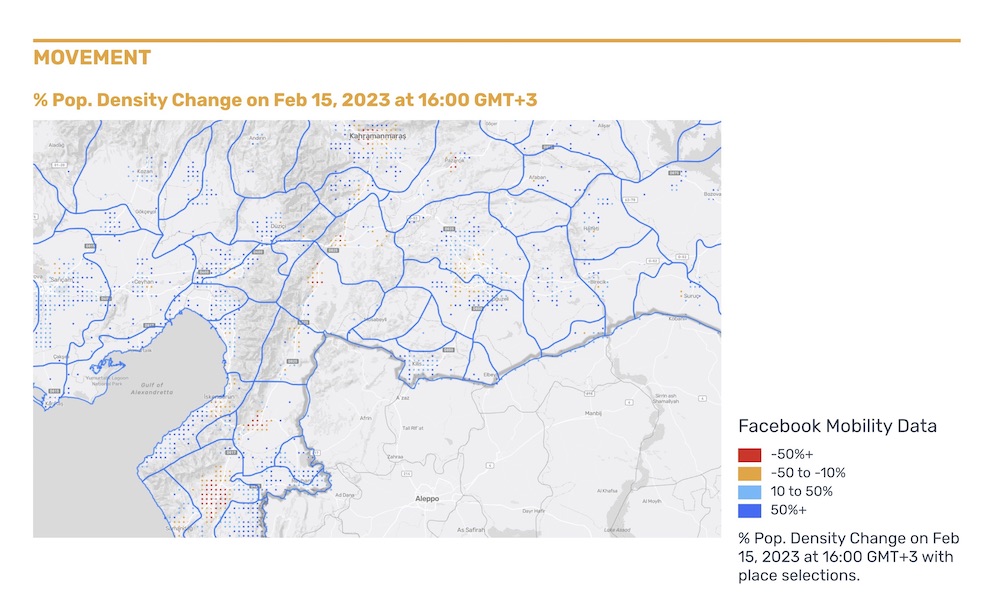
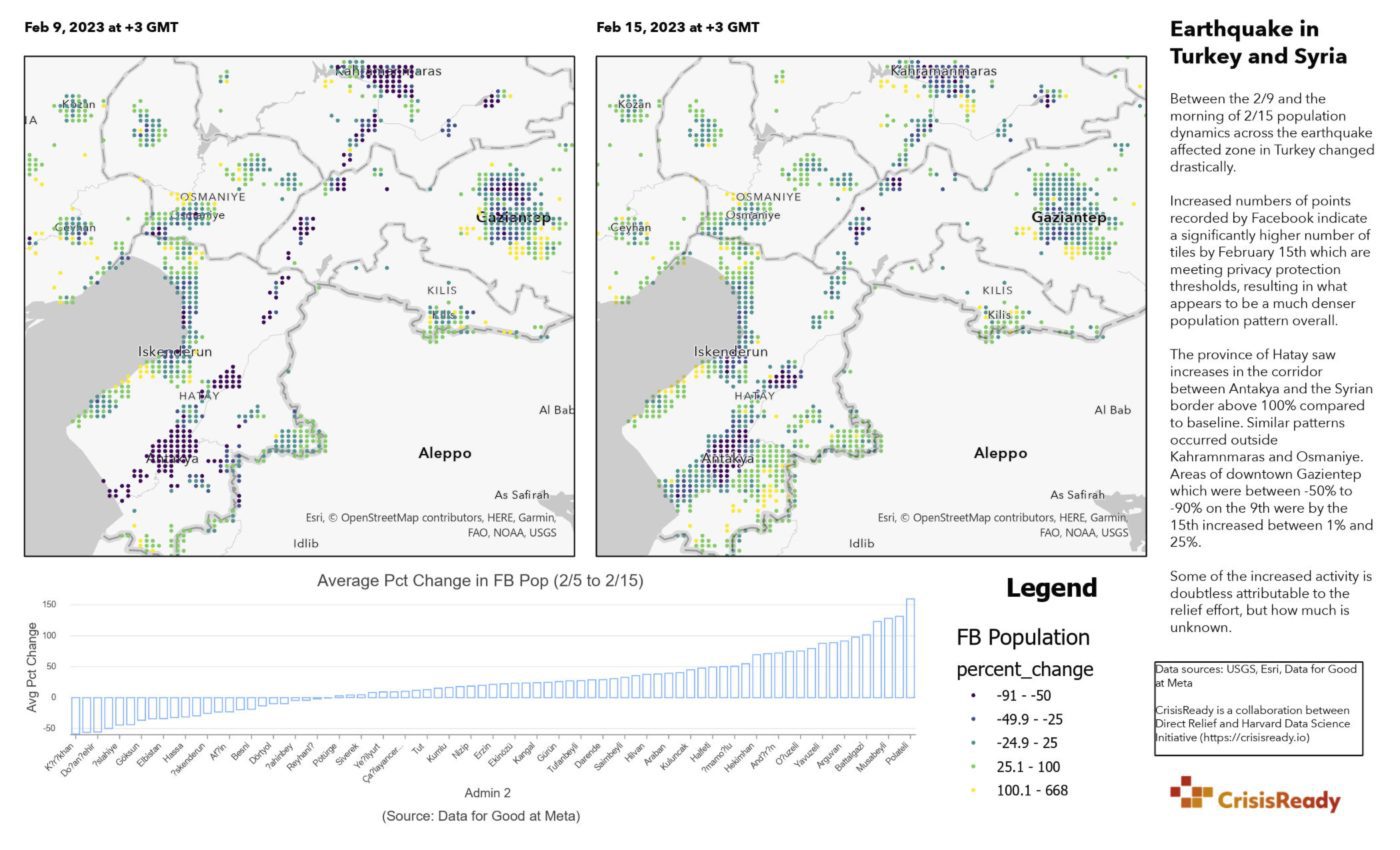
Wed, February 15, 2023
Turkey | 7:00 a.m. GMT+3
This report provides a comparison of population density changes between Thursday, February 9 and Wednesday, February 15 at 7:00 a.m. local time in the regions most impacted by the earthquakes in Turkey.
Key Observations
- Increased data points recorded by Facebook mobility data indicate a significantly higher number of tiles by February 15, which are meeting privacy protection thresholds, resulting in what appears to be a much denser population pattern overall.
- The province of Hatay saw population density increases in the corridor between Antakya and the Syrian border, which registered above 100% compared to baseline population values.
- Similar patterns occurred outside Kahramnmaras and Osmaniye.
- Areas of downtown Gaziantep, which saw population declines between -50% and -90% on February 9, increased between 1% and 25% by February 15.
Tues, February 14, 2023
Turkey | 7:00 a.m. GMT+3
This report provides information on population density changes recorded on Tuesday, February 14 at 7:00 a.m. local time in the regions of Turkey most impacted by the earthquakes.
Key Observations
- The following areas initially saw sharp decreases in population densities, but are now showing significant rates of population increase:
- Battalgazi: variance from -75% to +75%
- Mersin: variance from -75% to +26%
- Kilis: variance from -71% to +27%
- The following areas have consistently seen increases in population densities above baseline since the earthquake struck:
- Kumlu: variance from +65% to +40%
- Reyhanli: variance from +20% to +35%
- Erdemli: variance from +65% to +35%
- The following areas have consistently seen decreases in population densities below baseline since the earthquake struck:
- Hatay: variance around -75%
- Kirikhan: variance from -55% to -60%
- Malatya: variance from -55% to -60%
- The following areas are gradually returning to baseline population densities:
- Nurhak: variance from -70% to -5%
- Ayranci: variance from -75% to -5%
- Osmaniye: variance from -75% to -9%
- Representativeness of the Facebook population data ranges from 2% to 11% of total population.
Mon, February 13, 2023 | Data Report Feature
Data Report Feature: “Turkey Earthquake 2023 Daily Highlights – 10/13/23,” Data Friendly Space, International Federation of Red Cross And Red Crescent Societies (IFRC), iMMAP
CrisisReady’s ReadyMapper report on population density changes in Turkey as of Friday, February 10 was featured in a situational update published by Data Friendly Space, the IFRC, and iMMAP. Insights on population movement out of Kahramanmaraş and Hatay were used to highlight trends in displacement dynamics.
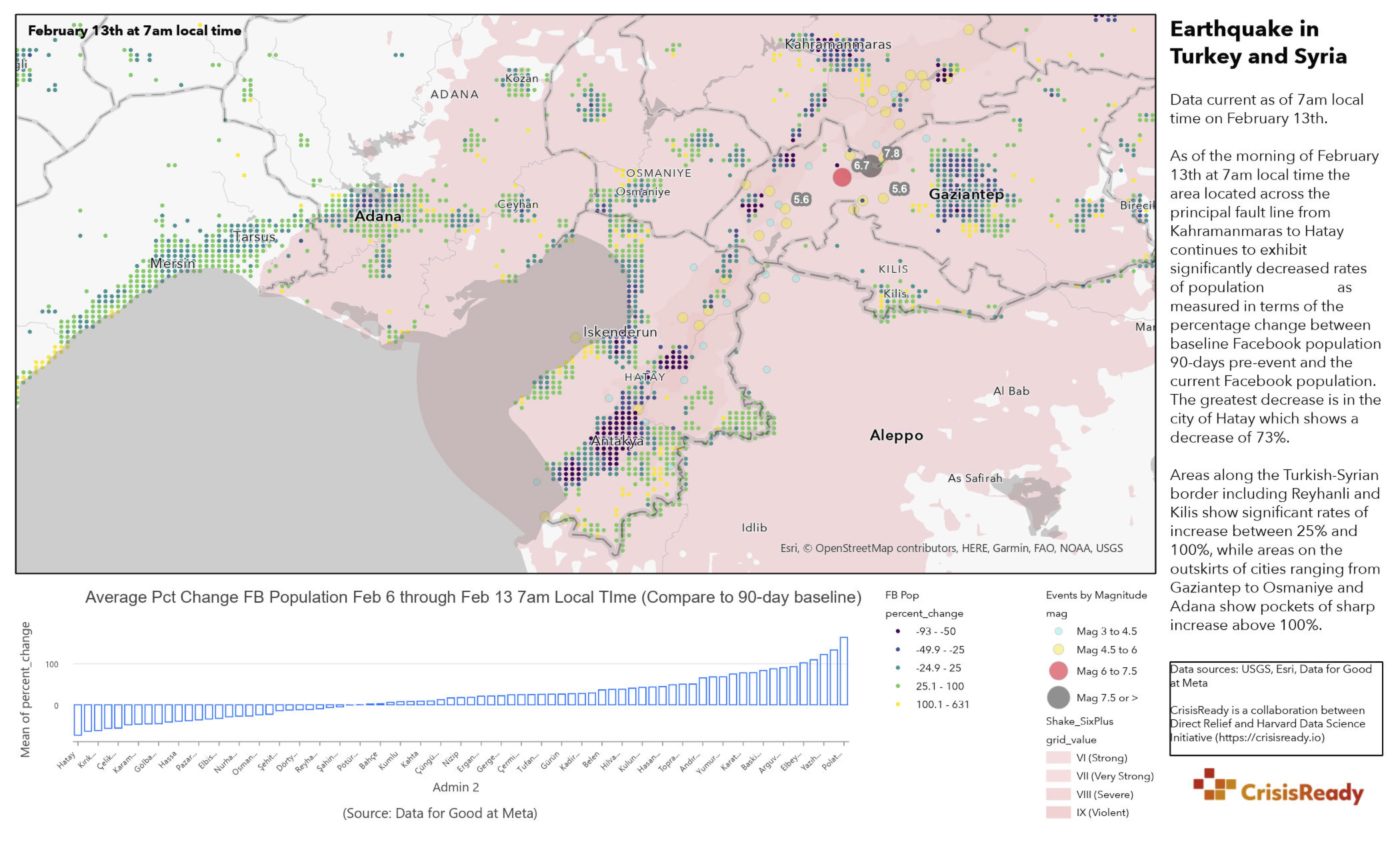
Mon, February 13, 2023
Turkey | 7:00 a.m. GMT+3
This report provides information on population density changes recorded on Monday, February 13 at 7:00 a.m. local time in the regions of Turkey most impacted by the earthquakes.
Key Observations
- At the time of analysis, the area located across the principal fault line from Kahramanmaras to Hatay continues to exhibit significantly decreased rates of population density.
- The greatest decrease registered was in the city of Hatay, which shows a decrease of 73% below baseline.
- Areas along the Turkish-Syrian border show significant rates of increase between 25% and 100%, while areas on the outskirts of cities, ranging from Gaziantep to Osmaniye and Adana, show pockets of sharp increase above 100%.
Sat, February 11, 2023
Turkey | 7:00 a.m. GMT+3
This report provides information on population density changes recorded on Saturday, February 11 at 7:00 a.m. local time in the regions of Turkey most impacted by the earthquakes.
Key Observations
- The most significant areas of population decline remain in the provinces of Kahramanmaras and Hatay, both of which are registering rates of decline over 30% for several days after the quakes struck the country.
- Key cities in those provinces are registering much more significant rates of decline between 35% and 75%.
- Areas such as Belen and Kumlu (in the Hatay province), Topprakale (East of Osmaniye), Reyhanlı (on the Syrian border), and Altınözü (Southeast of Antakya), however, have seen drastic reversals from population density rates as low as 75% below baseline on February 6 to 8, now increasing 30% – 90% above baseline during the February 9 – 11 period.
- Representativeness of Facebook population data relative to total pre-event population values ranges between 2% and 11% at the city-level.
Thurs, February 9, 2023
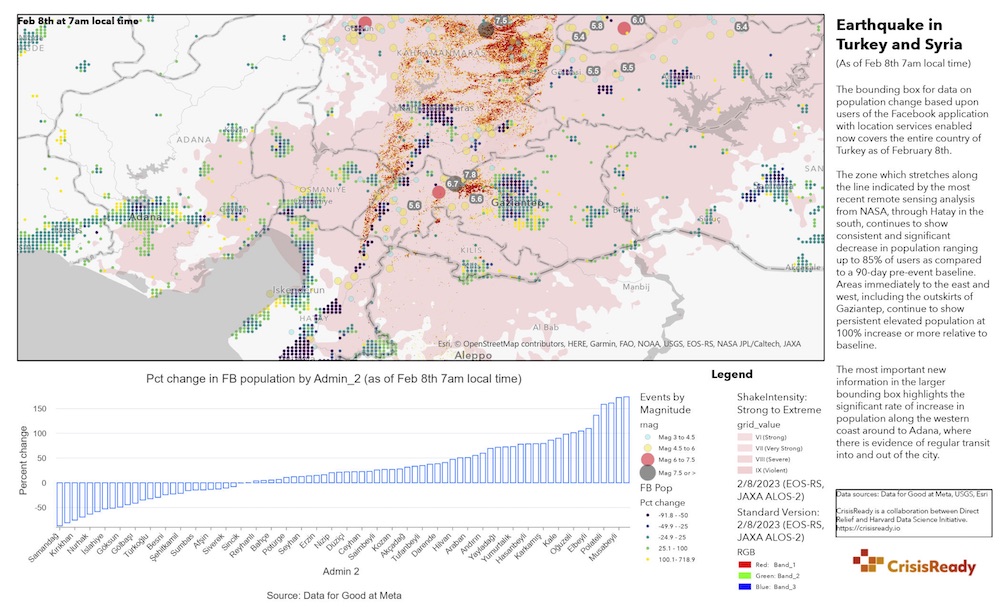
Turkey; Country-Wide | 7:00 a.m. GMT+3
This report provides information on population density changes recorded on Wednesday, February 8 at 7:00 a.m. local time across the entire country of Turkey.
Key Observations
- The zone that stretches along the line indicated by the most recent remote sensing analysis from NASA, through Hatay in the South, continues to show significant decreases in population densities, with some plummeting 85% below baseline.
- Areas immediately to the East and West, including the outskirts of Gaziantep, show persistent elevations in population densities at 100% increase or more relative to baseline.
- The larger bounding box, which now covers all of Turkey, highlights the significant rate of increase in population densities along the western coast near Adana, where there is evidence of regular transit into and out-of the city.
Fri, February 10, 2023 | Data Report Feature
Data Report Feature: “Turkey Earthquake 2023 Daily Highlights – 10/02/23,” Data Friendly Space, International Federation of Red Cross And Red Crescent Societies (IFRC), iMMAP
CrisisReady’s report on population density changes in Turkey on Wednesday, February 8 was featured in a situational update published by Data Friendly Space, the IFRC, and iMMAP. Insights from CrisisReady’s report were used to highlight patterns of displacement in the wake of the earthquakes.
Wed, February 8, 2023
South Central Turkey | 7:00 a.m. GMT+3
This report compares patterns of population density changes recorded on Monday, February 6 and Tuesday, February 7 at 7:00 a.m. local time in the areas impacted by the earthquakes in Turkey.
Key Observations
- Significant population decreases can be seen throughout the areas directly impacted by seismic activity, with significant areas of increase indicating a shift in population to the eastern and western cities and towns.
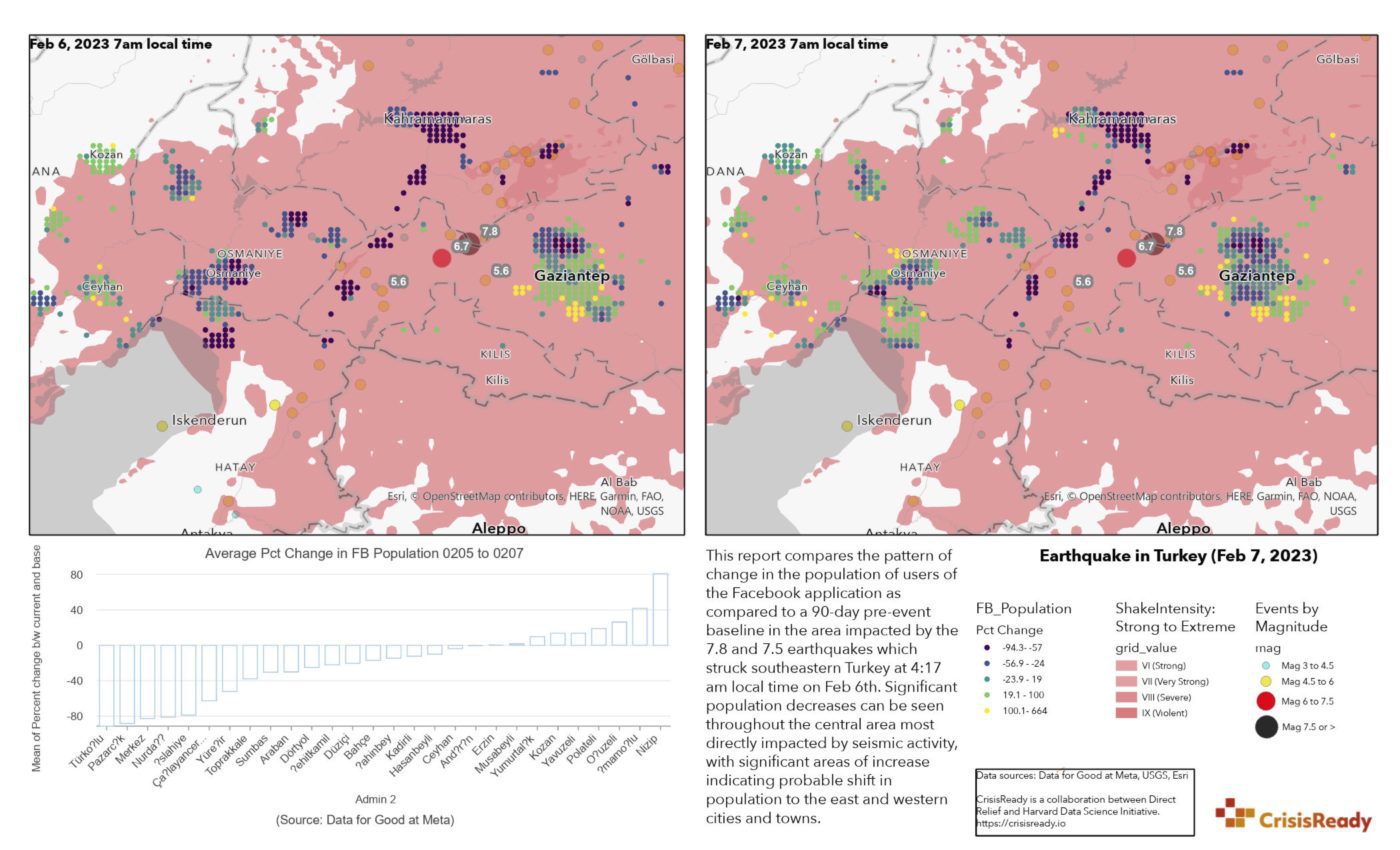
Tues, February 7, 2023
South Central Turkey | 7:00 a.m. GMT+3
This report provides insights on population density changes in Turkey as of the early morning of Tuesday, February 7, one day after the 7.8 and 7.5 magnitude earthquakes struck the southern regions of the country.
Key Observations
- Kahramanmaraş, a city northwest of Gaziantep located close to the epicenter of the quakes, saw the most significant decrease in population density since the disaster took place. The area saw an overall decline of 82%.
- Towns near Kahramanmaraş, including Nurdagi, Merkez, and Pazarcik saw declines between 78% – 85%.
- Gaziantep showed both a sharp decline in population density in the heavily populated city center and sporadic increases in population densities throughout the more sparsely populated areas towards the south of the city.
- Dortyol and Hasanbeyli saw sharp declines in population densities followed by equally sharp increases, which may be indicative of the influx of relief and rescue personnel entering the area rather than changes in local population dynamics. Investigations into these distinctions is ongoing.
- Representativeness of the Facebook population sample ranges from a high of 6% in Sehitkamil (Gaziantep) to lows below 1% in much smaller surrounding towns.
Mon, February 6, 2023
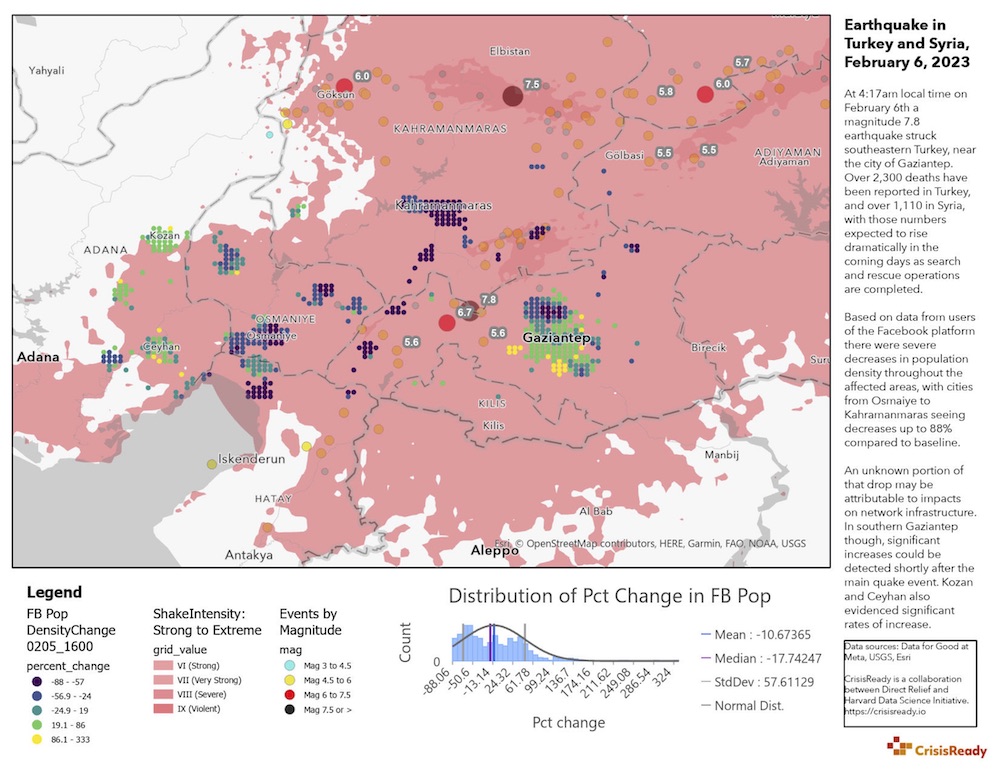
South Central Turkey | 7:00 a.m. GMT+3
This report provides preliminary findings on population density changes on Monday, February 6 at 7:00 a.m. local time in south central Turkey, following the 7.8 magnitude earthquake that struck the country that morning at 4:17 a.m. local time.
Key Observations
- At the time of analysis, there were severe decreases in population densities throughout all of the areas affected by the earthquake, with cities from Osmaiye to Kahramanmaras seeing decreases of up to 88% compared to baseline population values.
- An unknown portion of that decrease may be attributable to impacts on network infrastructure.
- In southern Gaziantep, significant increases in population densities could be detected shortly after the main quake took place.
- Kozan and Ceyhan also showed significant increases in population densities at the time of analysis.
For more information about the insights provided by Meta, please refer to this link.