Update: October 9, 2022
October 6 – October 9, 2022 | Pakistan (National Level)
This report provides an overview of population density changes at a national level.
Key Observations:
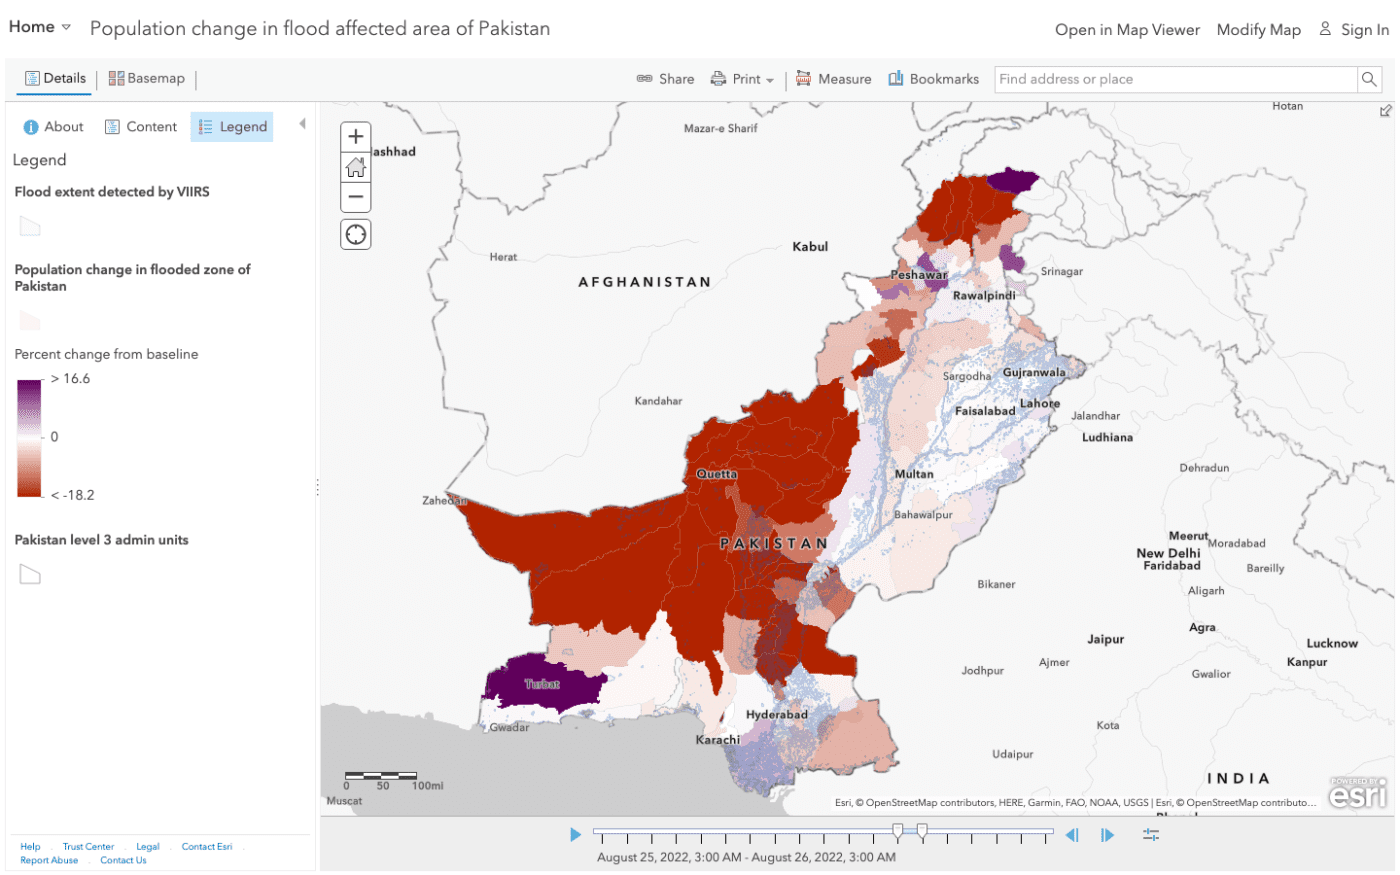
- The western regions of Pakistan experienced the largest declines in population density from August 24 to 30, 2022, reflecting the period of peak flash flooding in Balochistan.
- The average population density has gradually increased across regions throughout the country after August 30th, regardless of the number of Facebook users in each region relative to total population
- Among all admin level 2 units, Sibi and Nasirabad saw the lowest proportion of population return in the wake of peak flooding.
- The greatest increases in population density for urban areas directly proximate to heavy flooding occurred in Multan and Peshawar between August 29 and Sept 9.
October 6 – October 9, 2022 | Balochistan Province
This report provides an overview of population density and mobility changes in Balochistan, Pakistan.
Key Observations:
- The majority of administrative units in Balochistan saw significant population decreases compared to pre-event baseline during the peak of displacement.
- Kalat, Nasirabad, and Quetta recorded significant population drops from August 23 to September 4.
- Population remained much lower than pre-event baseline levels in Sibi for more than30 days. This trend started on August 13 and did not change until September 20.
- During the peak of population displacement (August 23 – September 4), mobility across level 2 units dropped everywhere except Makran.
October 6 – October 9, 2022 | Sindh Province
This report provides an overview of population density changes in the Sindh province of Pakistan.
Key Observations:
- Sindh recorded two peaks of population displacement, one before August 20, the other from August 23 to 29. In Sindh, population remained much lower than pre-event baseline for a shorter period of time compared to Balochistan.
- Sukkur’s population remained lower than baseline for a longer time than other level 2 admin units in Sindh.
- During both peaks of population displacement, rates of mobility also dropped significantly in Sindh. Although some increases in rates of mobility movement could be detected in level 2 admin units in Sindh on August 21 & 22, those increases may also be attributed to the urban commuting pattern that occurs periodically in these areas.
- Hyderabad, Larkana, Mirpur Khas, and Sukkur are the level 2 admin units with the most prominent decreases in mobility.
October 6 – October 9, 2022 | Khyber-Pakhtunkhwa Province
This report provides an overview of population density changes in the Khyber-Pakhtunkhwa province of Pakistan
Key Observations:
- Khyber-Pakhtunkhwa (K-P) recorded two peaks of population displacement, one beforeAugust 20, the other from August 23 to 29.
- The population of Dera Ismail Khan remained lower than baseline for longer than other level 2 admin units in K-P.
- Hazara and Makaland witnessed the longest period with significant decrease in mobility.
- The decrease in mobility for K-P coincided with the two major peaks of population displacement and lasted until September 21.
Update: September 13, 2022, 10:00 AM ET
- 33 million people have now been affected by massive floods in Pakistan.
- As of September 12, the number of fatalities has risen to roughly 1,400, according to Reuters.
- Damages are now estimated at $30 billion.
- The UN secretary general, António Guterres, attributed the disaster to climate change while visiting the devastated regions of Pakistan on Saturday, September 10. He stated that he has “never seen climate carnage” on such a scale and attributed the devastation to wealthier countries who
- Attention has been drawn to the electricity station in the district of Dadu in the southern province of Sindh, one of the country’s worst affected areas, which supplies power to six provincial districts; government officials worry the floods will damage or destroy the 500kV station.
- Pakistani troops have begun constructing dikes around the electricity station as preventative measures.
- On Monday, September 12, a dust storm in Sehwan — which is also in the Sindh province — uprooted hundreds of tents pitched by people displaced or made homeless by the flood.
- The Pakistan Meteorological Department predicts that heavy rainfall will continue over the next several days, exacerbating the threat of more flooding and destruction to the makeshift lodgings of people displaced or made homeless by the disasters.

Photo by Fida HUSSAIN / AFP) (Photo by FIDA HUSSAIN/AFP via Getty Images)

Image source: Press TV, Iran
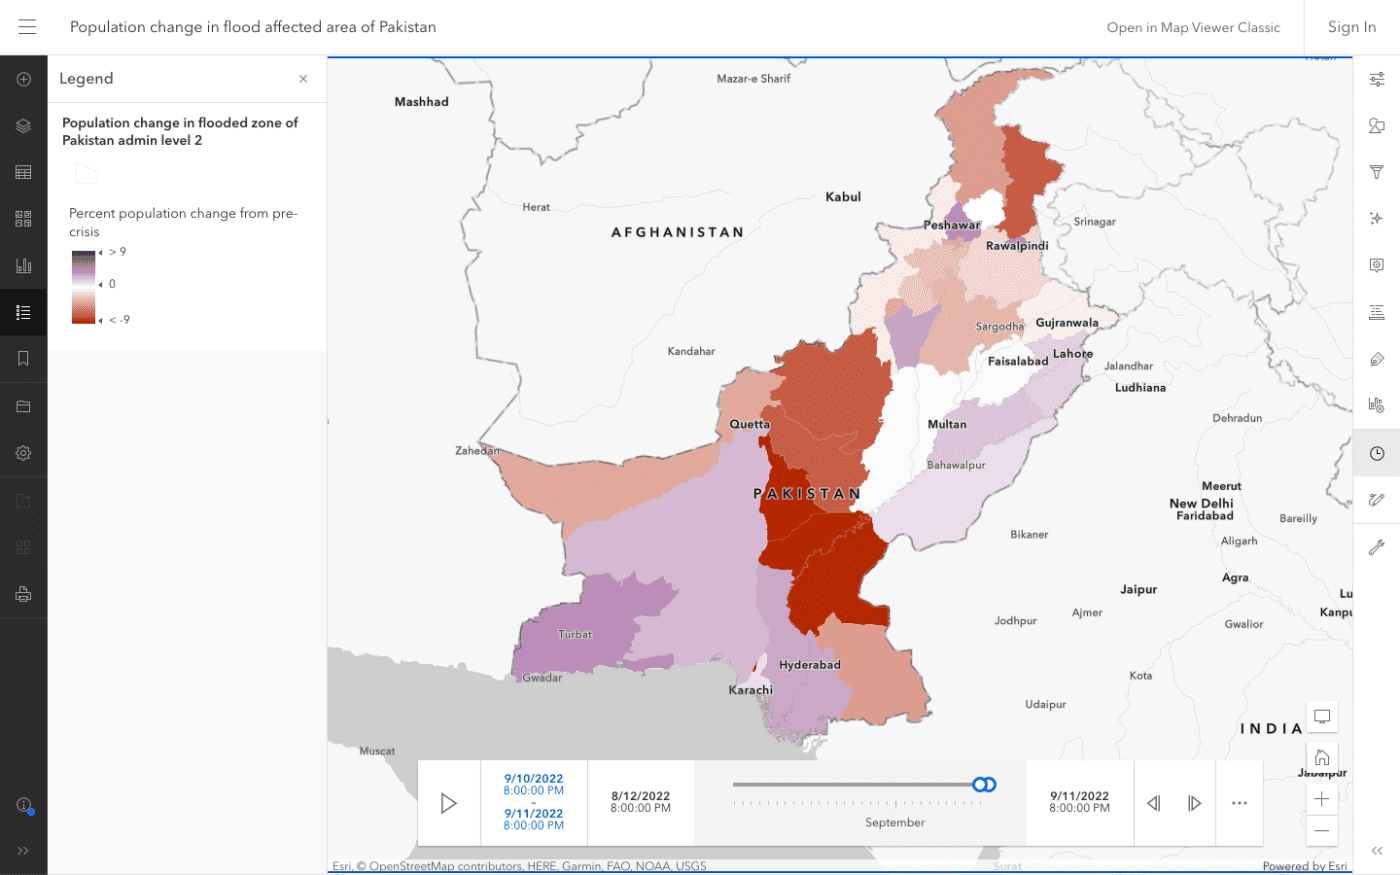
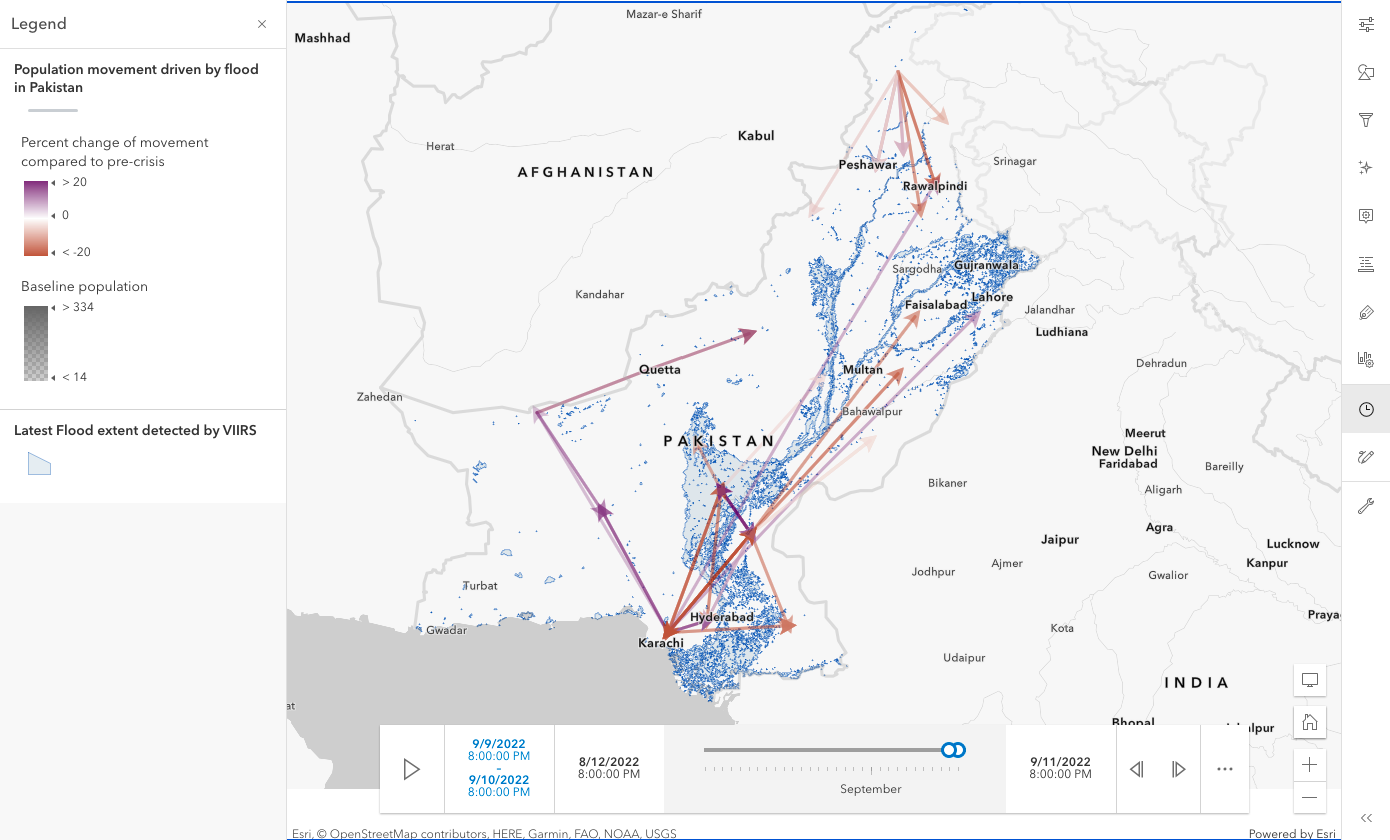
Updated map analyses from CrisisReady shed light on the evolving displacement patterns as floods continue to devastate Pakistan. A new data layer has been added in the maps below to show the population change at administrative level 2, as the tile level population update has recently encountered issues.
In the latest population density maps, most areas, especially the populous cities in the Northeast part of Pakistan, have returned to pre-crisis levels. The flooded zones of the south still experience significant decreases in population densities. Population mobility trends show heavy movement out of areas surrounding Hyderabad and Karachi, and into more northern cities like Lahore, Multan, and Quetta.
Update: September 7, 2022, 2:50 PM ET
- Over 95,000 square miles of Pakistan have been flooded, accounting for one-third of the country’s landmass.
- As of September 7, 2022, the floods have now caused at least 1,343 deaths; 152 more than recorded cases of mortality six days ago.
- Pakistani officials have stated that a little over a quarter of a million people are in shelters across the country.
- The floods have destroyed over 1.2 million homes, CNBC reports.
- Pakistan’s biggest lake, Manchar Lake, in the Sindh province is on the verge of overflowing. Three breaches have been made to the lake’s banks to protect surrounding areas; causing 100,000 people to be displaced.

Image Source: Fareed Khan/AP

Image Source: AP/The Indian Express
CrisisReady has published an interactive map that shows population movement patterns driven by the floods between August 13, 2022 and September 5, 2022. Data reflecting population movement originated from selected level 2 administrative units of Pakistan, including Karachi, Larkana, Malakand, Quetta, and Sukkur.
The red arrows (shown below) on the map show the directional patterns of population movement. The size (width) of the arrows correlates with the the volume of individuals displaced from the selected origins. The larger the arrow, the greater number of movement vectors. Transparency of arrows indicates the baseline population traveling between the origin and the destination under the pre-crisis situation.
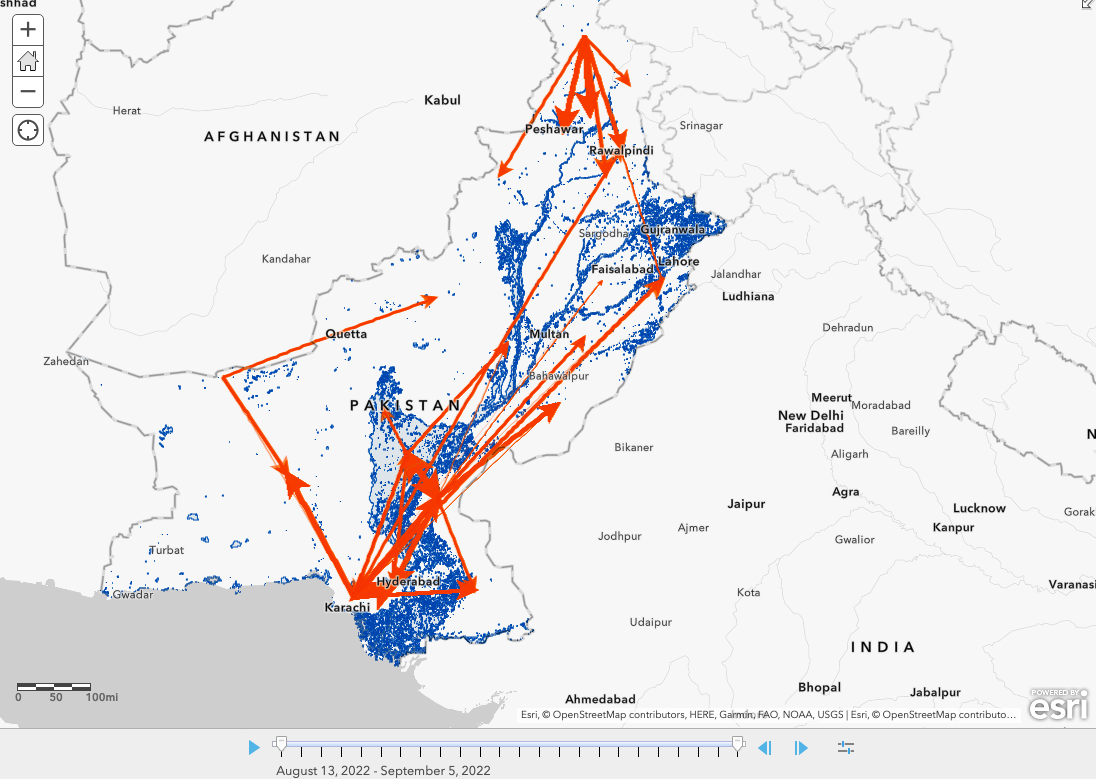
The maps were generated using data provided by Data for Good at Meta. For more information about the disaster population maps provided by Data for Good at Meta. Data on flood extent is gathered using the Visible Infrared Imaging Radiometer Suite (VIIRS), an instrument that collects visible and infrared images and global observations of the land, atmosphere, cryosphere, and oceans.
Update: September 1, 2022, 1:55 PM ET
Heavy rainfall in Southern Pakistan and melting glaciers in the country’s northern mountains have caused massive floods and flash floods that continue to devastate districts across the region. The floods have killed at least 1,191 people, of which 399 were children, since they began in mid-June at the beginning of monsoon season. In addition to this, a reported 3,554 individuals have been injured. The National Disaster Management Authority (NDMA) stated that as of August 29, 2022 more than 33 million people have been affected and more than 1 million houses have been destroyed.
Source: CNN World News
Source: CNN World News
The floods have spawned a critical humanitarian crisis as damage and displacement increases across the country. So far, 66 districts have been officially declared “calamity hit.” An estimated 50,000 people have been evacuated since rescue efforts began. Pakistan’s meteorological office has predicted that more flash floods are expected throughout September.
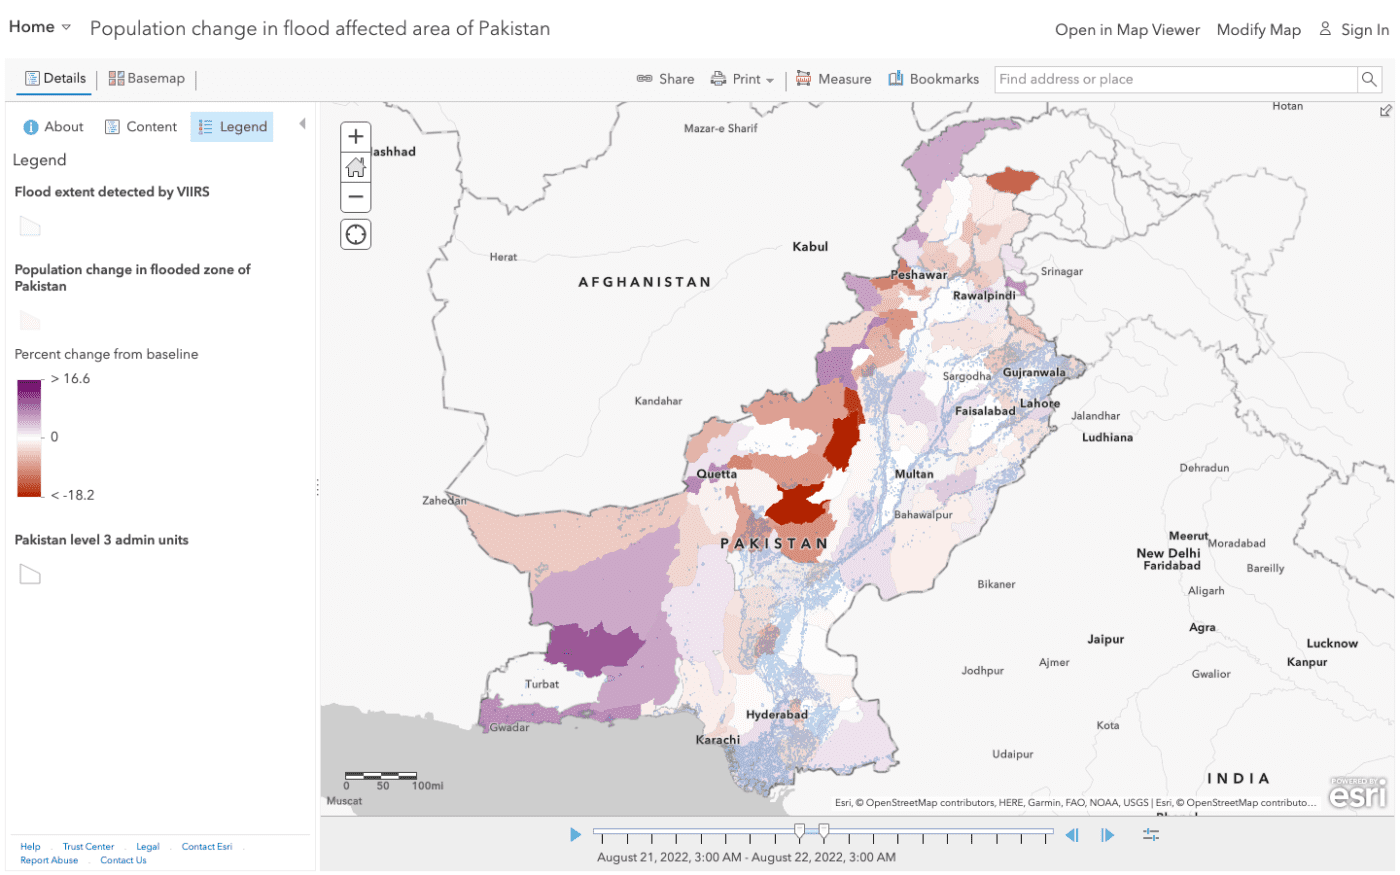
New maps showing population changes in the areas affected by the floods have been generated by CrisisReady and Direct Relief. The maps feature human mobility data collected between August 13 and August 30, 2022.
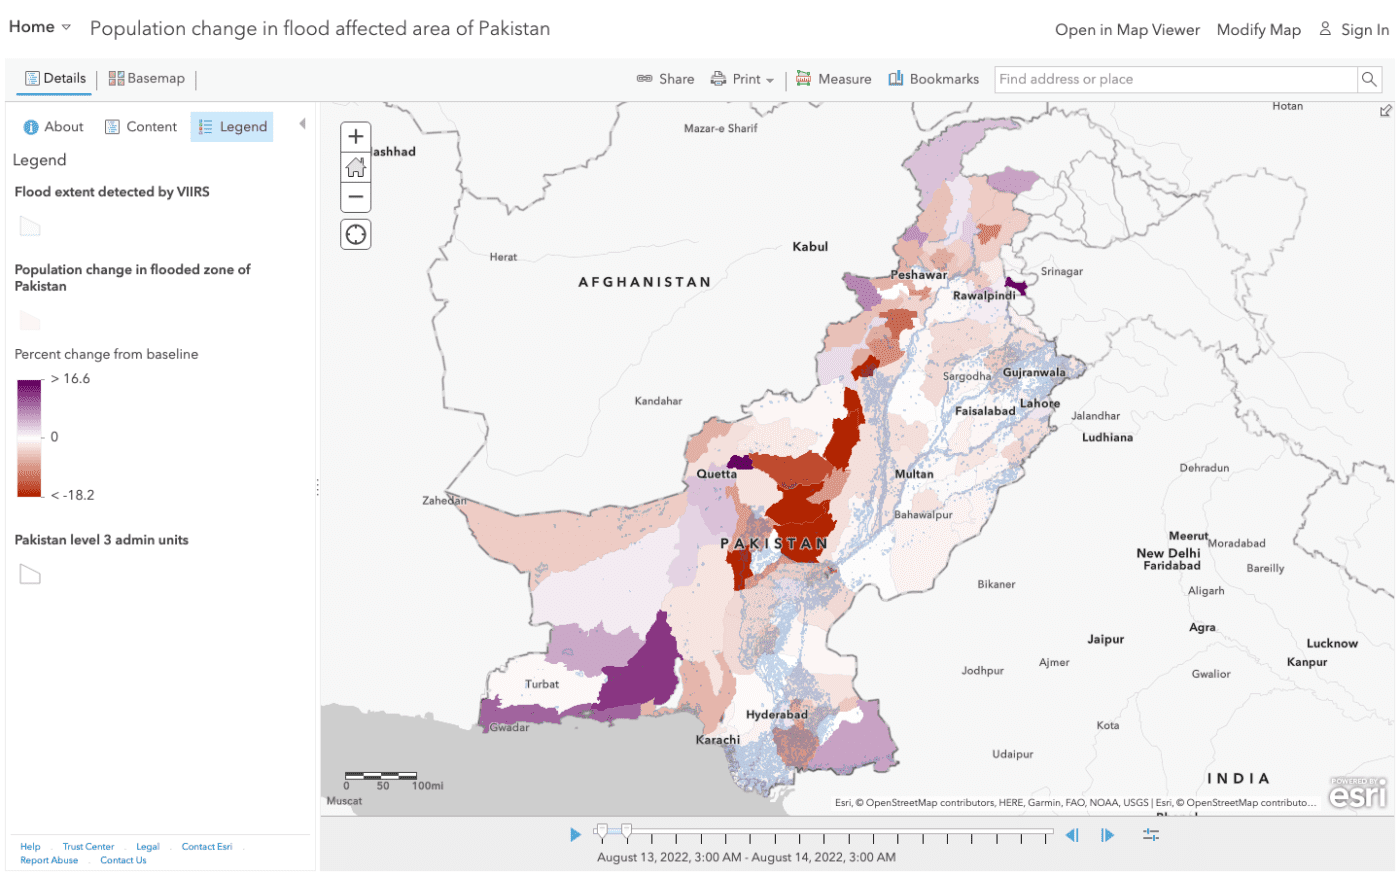
Population Density Changes in Flooded Areas of Pakistan
Population Density Changes in Flooded Areas of Pakistan
Population Density Changes in Flooded Areas of Pakistan
Population Density Changes in Flooded Areas of Pakistan
Population Density Changes in Flooded Areas of Pakistan
Population Density Changes in Flooded Areas of Pakistan
Population Density Changes in Flooded Areas of Pakistan
Population Density Changes in Flooded Areas of Pakistan
Population Density Changes in Flooded Areas of Pakistan
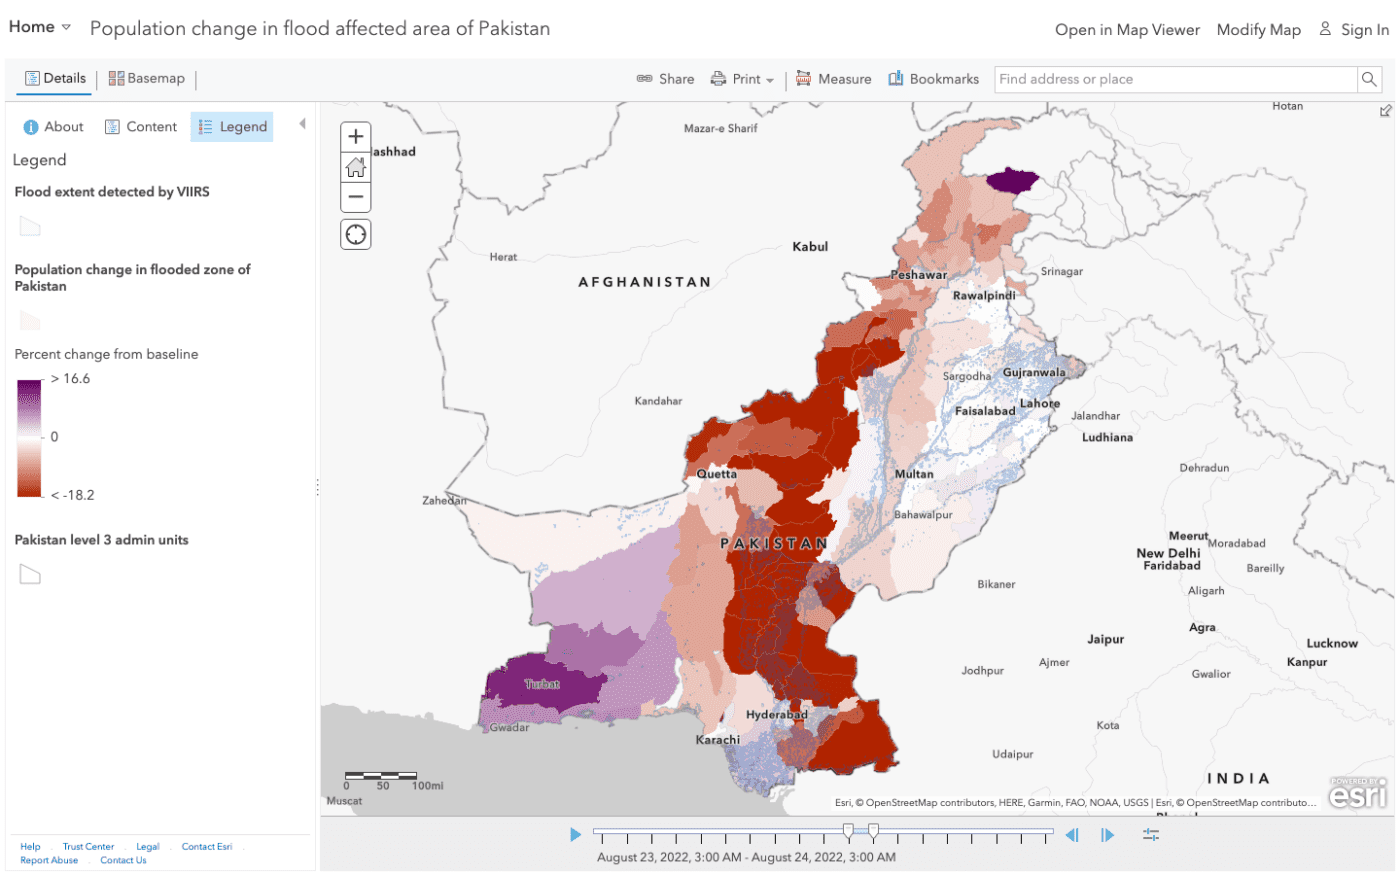
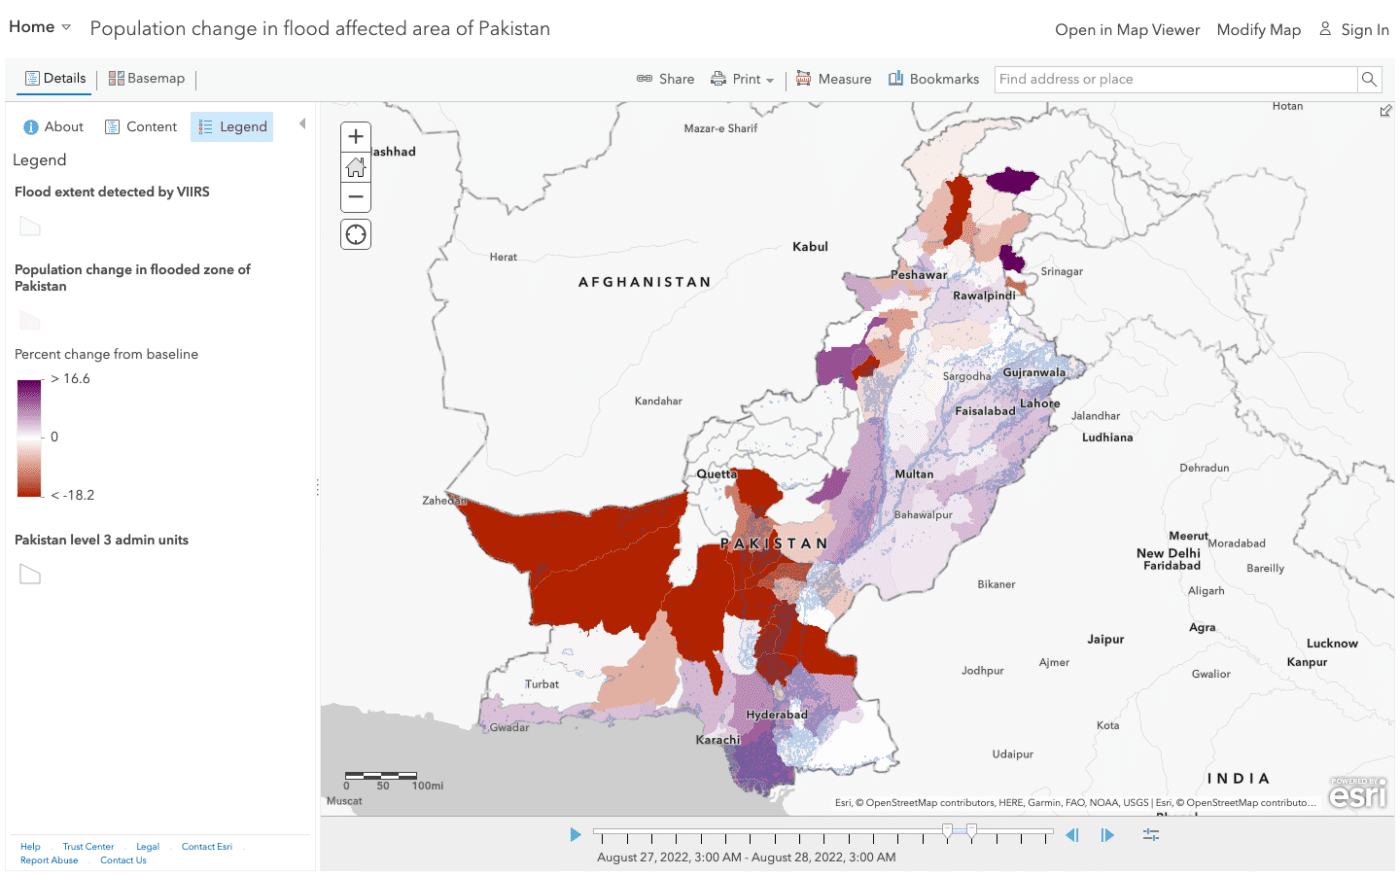
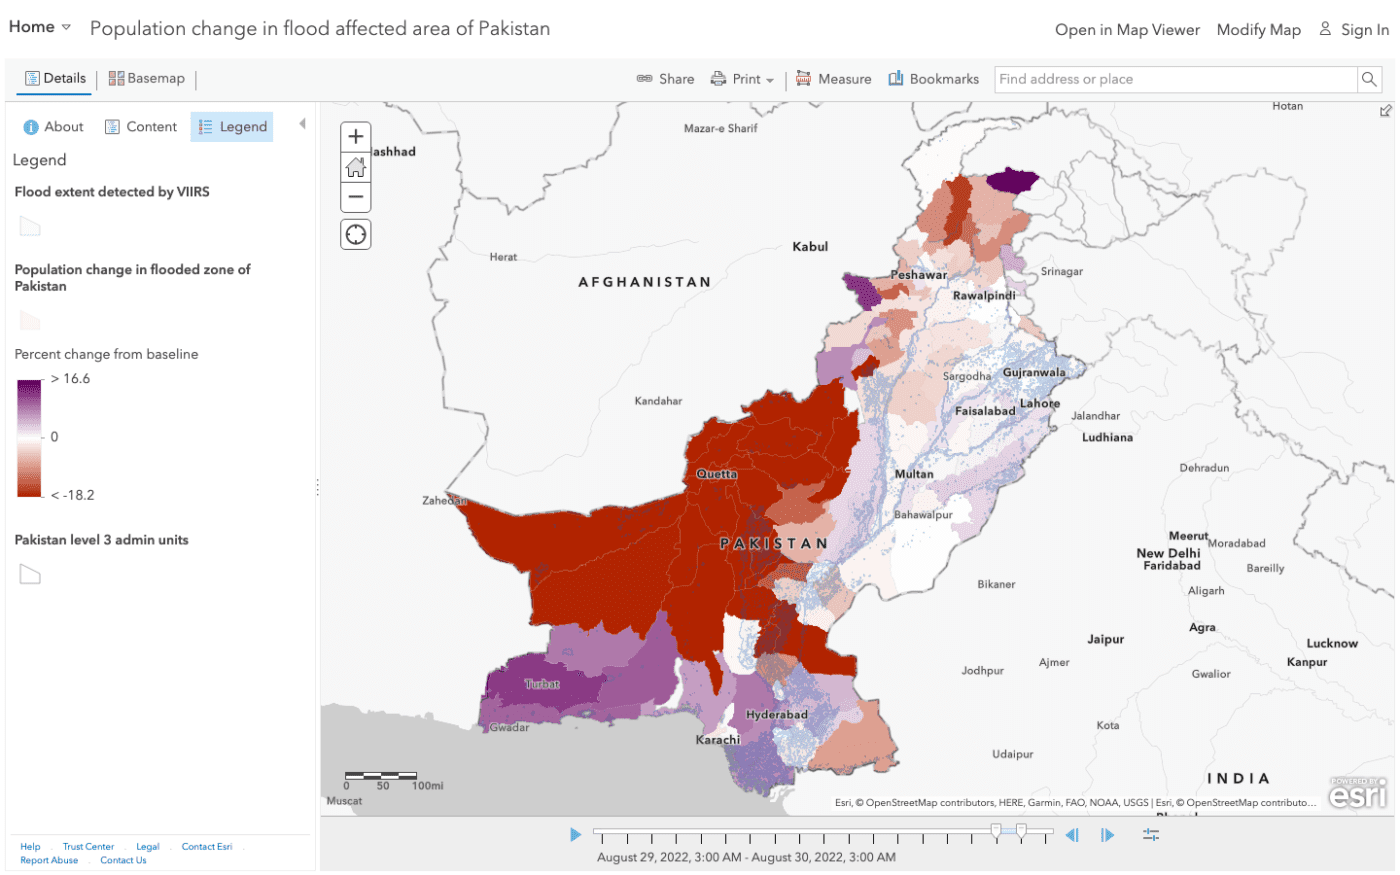
Interpretation
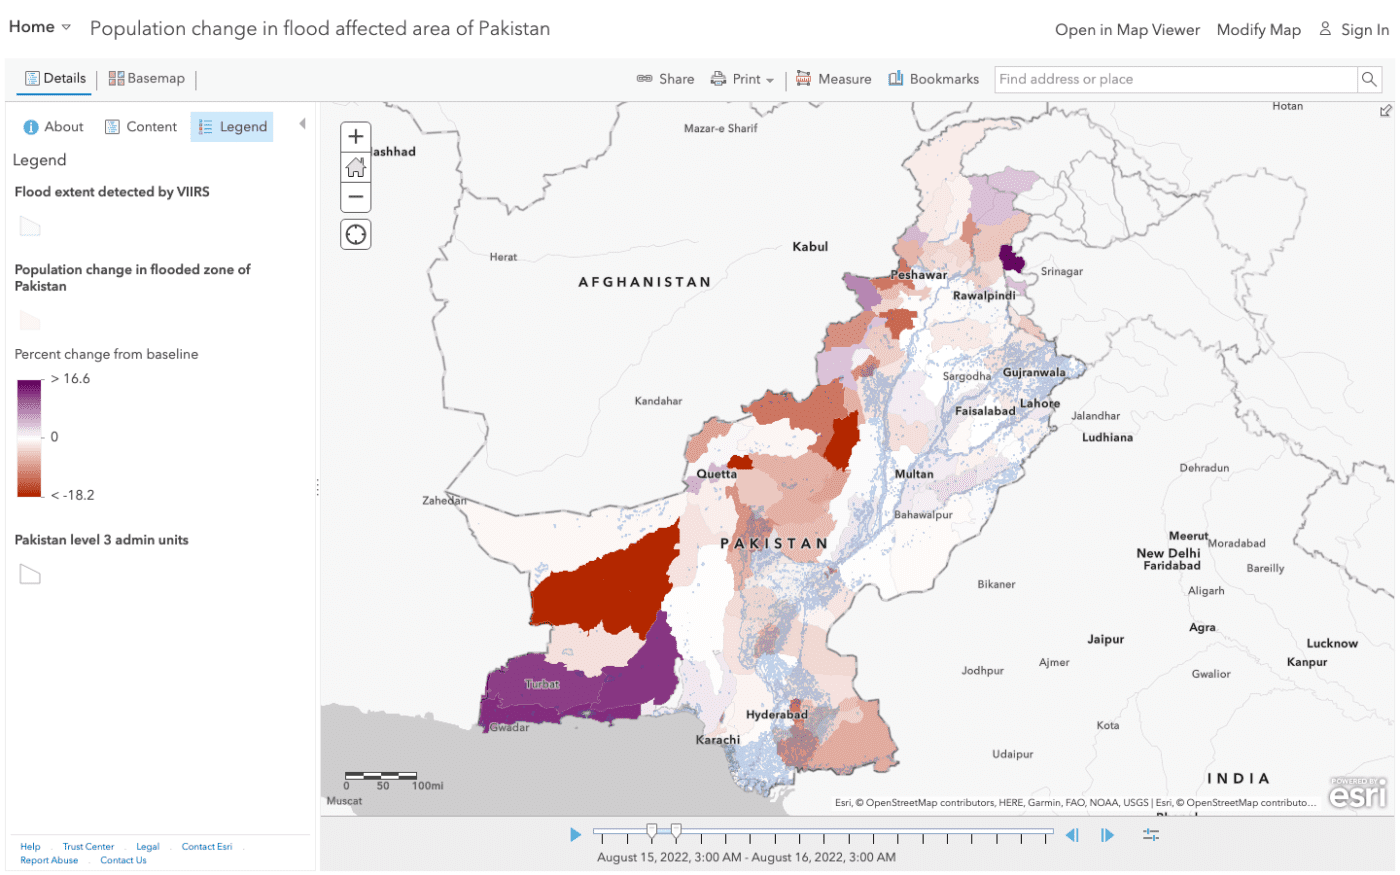
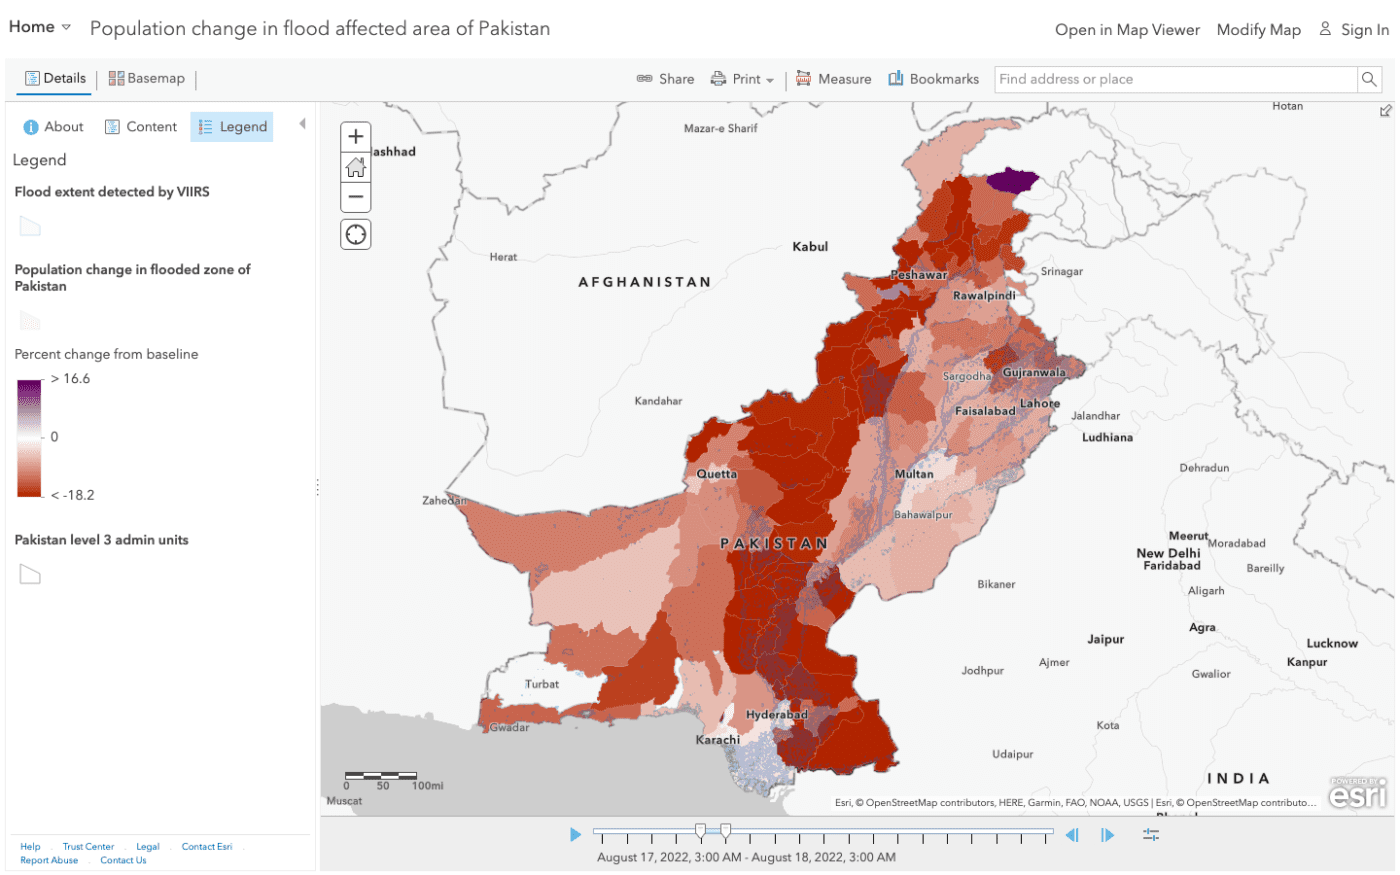
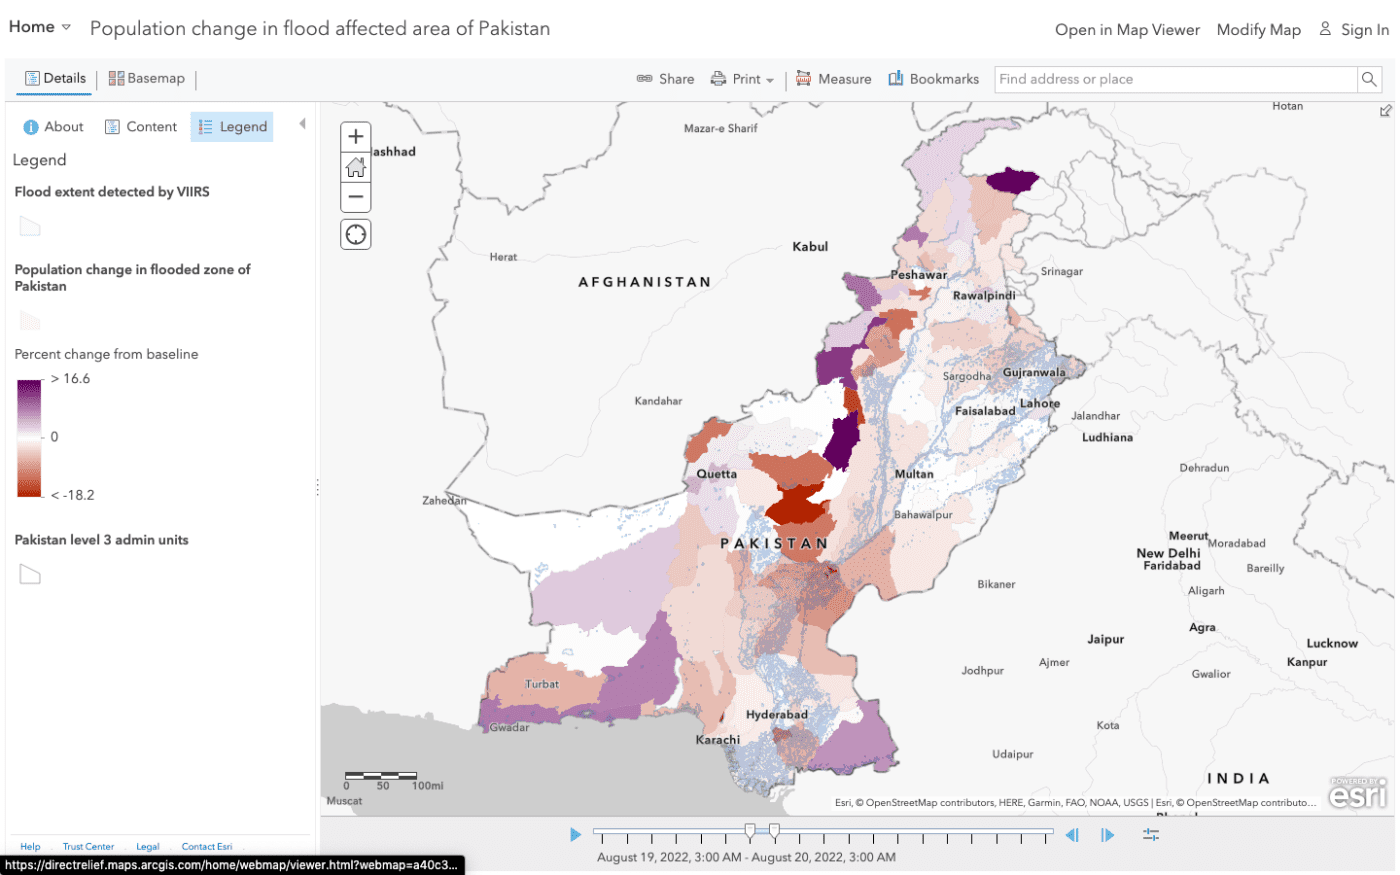
The maps above show changes in population densities in areas affected by floods in Pakistan between August 13, 2022 — August 30, 2022. Population density changes were determined using mobility data from Meta’s Data for Good program. Percent changes were calculated based on the number of Facebook users in a specified area and during a specified time compared to pre-crisis baseline population densities.
Purple regions represent increasing population densities.
The maximum positive percent change shown on the maps is > 16.6
Regions that are more saturated represent greater percent increases from baseline values
Regions that are less saturated represent lower percent increases from baseline values
Red regions represent decreasing population densities.
The minimum positive percent change shown on the maps in < -18.2
Regions that are more saturated represent greater percent decreases from baseline values
Regions that are less saturated represent lower percent decreases from baseline values
Data Layers
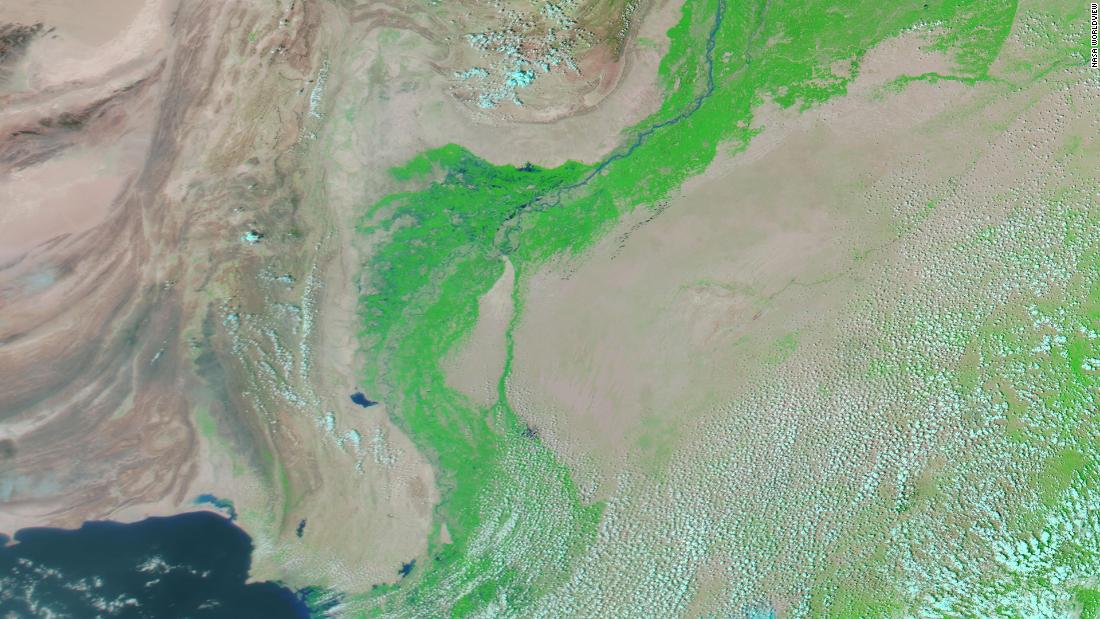
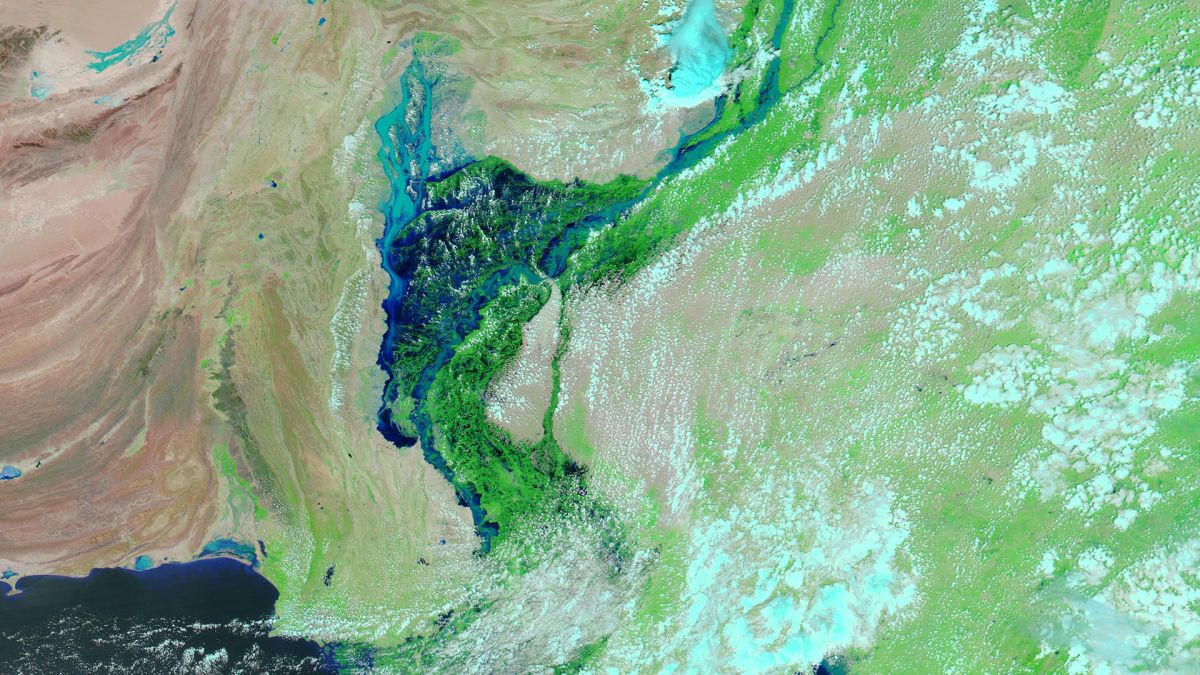
Flood extent
Data on flood extent is gathered using the Visible Infrared Imaging Radiometer Suite (VIIRS), an instrument that collects visible and infrared images and global observations of the land, atmosphere, cryosphere, and oceans.
The suite is owned by the National Environmental Satellite, Data, and Information Service within the National Oceanic and Atmospheric Administration.
Population Changes in Flooded Areas
These data show population changes compared to pre-crisis baseline in Pakistan on a daily basis for all level 3 administrative units of Pakistan. The data is time-enabled to show the change from August 13, 2022 to the latest date when population change data harvested by Data for Good at Meta is available.
Population maps provided by Data for Good at Meta are generated based on users of Facebook. For more information about the disaster population maps provided by Data for Good at Meta, please refer to this link.
Pakistan Level 3 Administrative Units
These data show the administrative boundaries of the third sub-national level in Pakistan.
Data Sources
- Data for Good, Meta
- GADM
- United Nations Satellite Centre (UNOSAT)