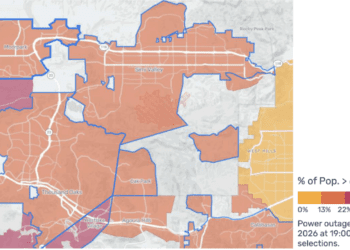
CrisisReady has released a new report analyzing population mobility data in Jamaica in the weeks following Hurricane Melissa, which struck the island as a Category 5 storm on October 28, 2025. This analysis covers the period from November 3 to November 17, 2025.
In the two weeks captured by this report, widespread power and network outages were reported, particularly across the western parishes. Housing and other infrastructure sustained massive damage, leading to reports of substantial but localized displacement.
How the analysis works
The report draws on location data from Facebook users, provided by AI for Good at Meta, to analyze patterns of population increase and decrease across Jamaica since the storm. To assess these patterns rigorously, the analysis applies the Mann-Kendall statistic, which evaluates the significance of change in values between time periods to determine whether there is a notable upward or downward trend. Here, the test is applied to the Z-score of population change relative to a 90-day pre-storm baseline.
What the data shows
Areas of high population along the southeastern coast, particularly Kingston, do not show statistically significant trends — they display neither clear upward nor downward movement. Significant upward trends appear in St. Catherine, Manchester, and St. Elizabeth, as well as along parts of the northern coast.
An important interpretive note: because population here is measured by device connections, some of these upward trends may reflect the return of power and network connectivity rather than the physical movement of people back into an area. This distinction matters for how response teams read the map and act on it.
Why it matters
In the aftermath of a major storm, understanding where people are — and where they are returning — is critical for targeting relief, planning recovery, and identifying communities still cut off from power and communications. Mobility analyses like this one supplement traditional information streams to give responders a faster, more granular view of a rapidly evolving situation.
This report was produced by CrisisReady in partnership with Direct Relief and the Harvard Data Science Initiative, using data provided by AI for Good at Meta. View the full map and report on ReliefWeb: https://reliefweb.int/map/jamaica/hurricane-melissa-jamaica-november-3-november-17-2025-facebook-population-trends-based-z-score-difference-between-baseline-and-crisis